.png.webp)
Boost Your Trading Strategy with MACD MT4 Indicator Setup Guide
MACD MT4 is one of the most popular technical analysis tools favored by investors. This article will help you understand more about the MACD indicator, how to use it on the MT4 platform and some effective trading strategies based on MACD.
What is MACD MT4?
MACD stands for Moving Average Convergence Divergence. This is one of the most widely used technical indicators for analyzing stock markets, forex and other financial markets.
MACD calculation formula:
MACD = EMA (12) - EMA (26)
MACD will have a positive value when the 12-day moving average value is higher than the 26-day moving average value.
MACD will have a negative value when the 12-day moving average value is lower than the 26-day moving average value.
How does MACD work?
MACD compares two exponential moving averages (EMA) with different cycles to determine market momentum and trends. These lines are:
- MACD line: Calculated by subtracting the short-term EMA from the long-term EMA.
- Signal line: Is an EMA of the MACD line.
When the MACD line crosses up above the signal line, it is often a buy signal. Conversely, when the MACD line crosses down below the signal line, it is often a sell signal.
Reasons for using MACD
- Determine trend: MACD helps determine market trends effectively.
- Determine buy and sell points: Crosses between the MACD line and signal line provide clear buy and sell signals.
- Detect divergence: MACD can detect divergence, an early sign of a trend reversal.
- Easy to use: MACD is built-in in MT4, easy to customize and use.
MACD is an extremely useful technical indicator for trading, and MetaTrader 4 (MT4) is one of the most popular platforms for using this indicator. Here are detailed instructions on how to add MACD to your charts on MT4:
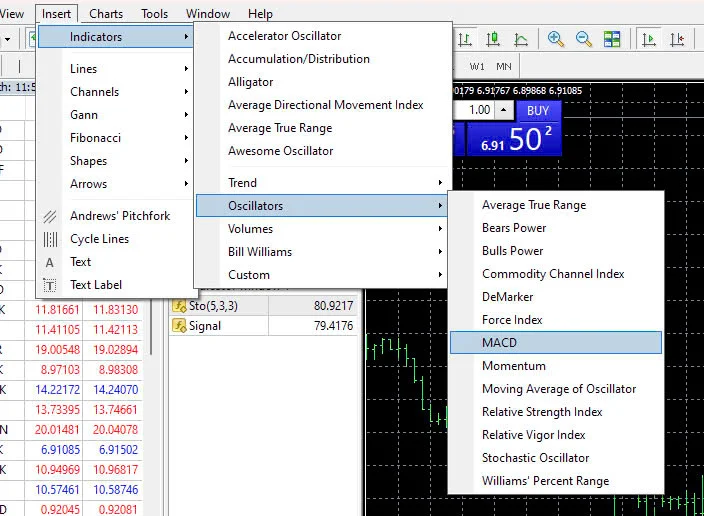
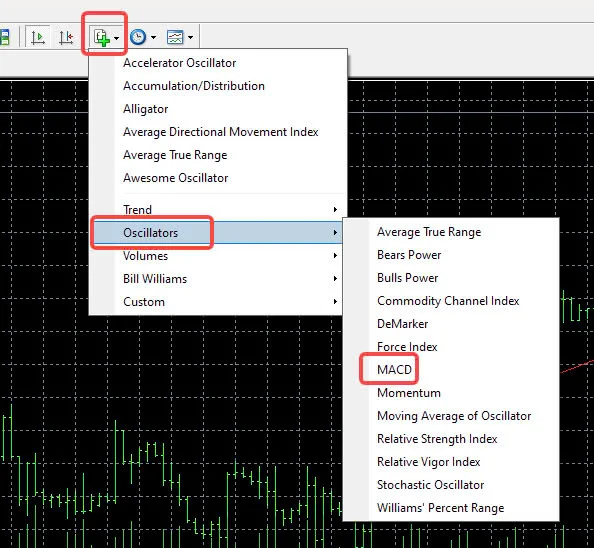
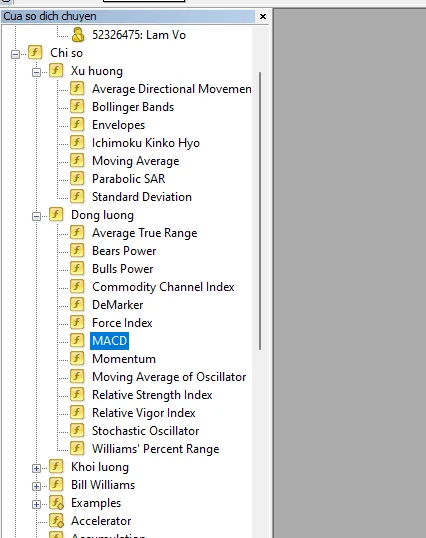
Step 1: Find the indicator tool function. There are 3 ways to open:
Way 1: From the toolbar, click Add > Support Tools > Oscillators > MACD
Way 2: From the icon bar, click the + sign > choose Oscillators > MACD
Way 3: From the shifting window in the bottom left corner of the screen, choose Indicators > Oscillators > MACD, drag and drop it onto the chart you want to apply (click and hold the left mouse button -> drag and drop).
Step 2: A MACD setting popup window will appear, you can use the default settings without configuring, click OK to apply MACD.
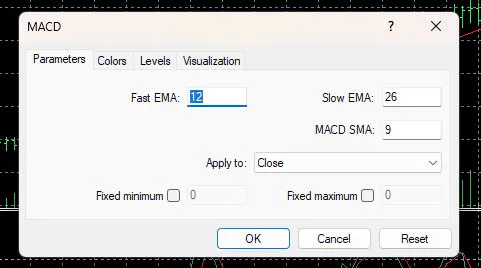
Standard MACD setting values:
- Fast EMA (Fast EMA): 12 (candle)
- Slow EMA (Slow EMA): 26 (candle)
- MACD SMA: 9 (candle)
"Candle" here refers to the number of candlesticks on the chart.
On a daily chart, each candle represents one day of trading, so the 12-day EMA is the exponential moving average calculated over 12 days. For a 4-hour chart, the 12-hour EMA is equivalent to the EMA over 12 candles x 4 hours (12 candles x 4 hours).
The parameters can be customized, but typically the long-term EMA value is twice the short-term EMA. The MACD SMA is usually defaulted to 9, with a smaller value making the trading signals clearer, but a larger value may make buy/sell signals less distinct.
Step 3: Done. The screen will display:
.png.webp)
? How to delete MACD on MT4 PC.
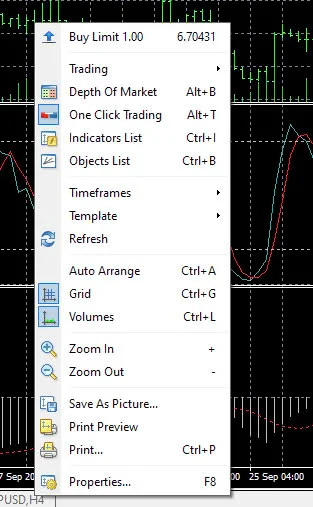
To remove MACD, the operation is also very simple. Right click on the chart => choose Support Tools
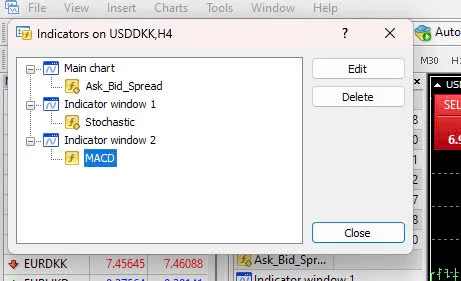
Next select MACD -> Delete
Method of displaying MACD on MT4 mobile
To display the MACD indicator on the MetaTrader 4 (MT4) mobile app, you can follow these steps:
Access the chart screen from the "Charts" tab in the MT4/MT5 app, then tap the "f" icon on the chart and select "Main Window" from the indicators menu.
Choose "MACD" under Oscillators from the "Add Indicator" screen to open the settings window.
If you don't need to change the settings, just tap "Done" to complete adding the MACD indicator.
Method of trading using MACD MT4
MACD is a useful tool for market analysis and making trading decisions. However, to be successful, you need to fully understand how it works, combine it with other analytical skills and always follow risk management principles.
Predicting market price trends based on 0 level
The MACD chart shows the divergence between the two moving averages, and their intersection point at the 0 level.
When the two moving averages cross each other, it can create signals like Dead Cross or Golden Cross, helping you make trading decisions based on the 0 level.
If MACD is above the centerline (0), it indicates the market has an upward trend (buy signal). Conversely, if MACD is below the centerline (0), the market has a downward trend (sell signal).
Timing for trading
The 0 level of MACD is similar to the signal of Dead Cross and Golden Cross patterns in moving averages. Therefore, you can place a "Buy" order when MACD moves from below 0 to above 0.
Additionally, if MACD moves from the 0 level downward below the negative level, this can also be a sign to consider a "Buy" order.
Trading based on predicting buy and sell signals at the time MACD crosses the signal line
Trading based on crosses between the MACD line and signal line is one of the most popular methods when using the MACD indicator. This is a simple yet effective strategy, especially when combined with other technical analysis factors.
Basic principles:
- Buy signal: When the MACD line crosses up above the signal line, it indicates an upward trend may be forming or strengthening.
- Sell signal: When the MACD line crosses down below the signal line, it indicates a downward trend may be forming or strengthening.
.png.webp)
Tips and remedies for MACD MT4 weaknesses
MACD (Moving Average Convergence Divergence) is one of the most popular technical analysis tools used by traders to determine trends and buy/sell points. However, like any other tool, MACD also has its own advantages and disadvantages.
Advantages of MACD:
- Easy to use: MACD is displayed in a simple line chart form, easy to understand and compare to price.
- Variety of signals: Includes both confirmation and reversal signals.
Applicable to various timeframes, from short term to long term.
Disadvantages of MACD and remedies:
- In volatile or sideways markets, MACD can generate many false signals, confusing traders.
- Cannot determine exact entry points: MACD only shows the general trend of the market, cannot determine the exact optimal entry point.
To overcome the above limitations, you can combine MACD with other technical analysis tools or apply the following trading strategies:
- Combine with other indicators:
- Stochastic: Used to confirm MACD signals and determine overbought/oversold zones.
- RSI: Helps determine market overbought/oversold levels and look for reversals.
- ADX: Measures trend strength, helps determine when to enter trades and when to stand aside.
- Use support and resistance levels: Combine MACD with S/R levels to identify potential entry points.
- Observe price action: Always observe price movement on charts to confirm MACD signals and avoid false signals.
- Strict risk management: Use stop-losses to limit losses in case the market moves against predictions.
- Patience and discipline: Trade according to a specific plan and adhere to discipline as important success factors.
Understanding and proficiently using MACD will help gain more confidence in investment decisions. As part of a toolkit, combine MACD MT4 with own knowledge and experience to make sound decisions.


.png.webp)

.png.webp)