.png.webp)
How to Use Stochastic MT4 Indicator in Forex Trading
Stochastic MT4 indicator is a useful tool to identify potential buy and sell points by measuring overbought and oversold levels in the market. When combined with other technical indicators and fundamental analysis, Stochastic can help improve your trading strategy on MT4. In this article, I will help you understand this indicator and how to apply it in trading. Let's take a look!
Calculating Stochastics
Stochastics is a technical indicator used to identify trend reversals by assessing the "overbought" or "oversold" state of the market. Developed in 1950 by American chartist George Lane, it is a contrarian trading method.
Stochastics appears in a sub-window of the chart. When its two indicators are at 30% or below, this is often considered an oversold signal and suggests placing a buy order. Conversely, if the two indicators reach 70% or above, it is seen as an overbought signal and you should consider a sell order.
Stochastic Calculation
The stochastic calculation formula is as follows:
- %K = {(Closing Price - Lowest Price of n period in the past) / (Highest Price of n period in the past - Lowest Price of n period in the past)} x 100%
- %D = {(Sum of m periods of (Closing Price - Lowest Price of n period in the past)) / (Sum of m periods of (Highest Price of n period in the past - Lowest Price of n period in the past))} x 100%
- Slow%D (SD) = SMA (Simple Moving Average) of %D over x periods
Where:
- %K: This is the main line of the Stochastic indicator, showing the ratio between the closing price and the price range over a specific time period.
- %D: This is the moving average of %K, smoothing price fluctuations and clarifying trading signals.
- Slow %D (SD): This is the single moving average of %D, further reducing volatility and smoothing trading signals.
Key Parameters:
The main values entered will be "n", "m", "x"
- n: The time period to calculate the highest and lowest prices in the past. Typically 14 days.
- m: The time period to calculate the moving average of %K. Typically 3 days.
- x: The time period to calculate the moving average of %D. Typically 3 days.
How to Display Stochastic MT4/MT5 Indicator
How to display stochatics on MT4/MT5 for PC
From the MT4/MT5 window, choose "Add" -> "Support Tools" -> "Options" -> Stochastic". Drag and drop the indicator onto the chart you want to apply it to.
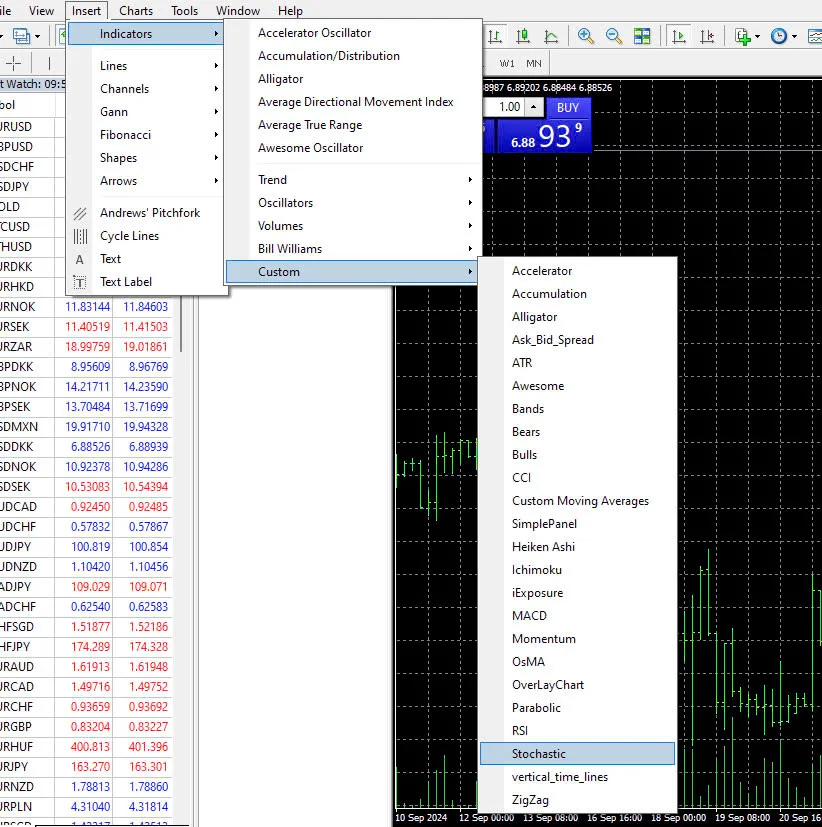
To Configure Stochastic:
By default, MT4/MT5 sets the Stochastic parameters as "%K=5", "%D=3", "Slow (SD)=3". You can use Stochastic with these parameters without changing them.
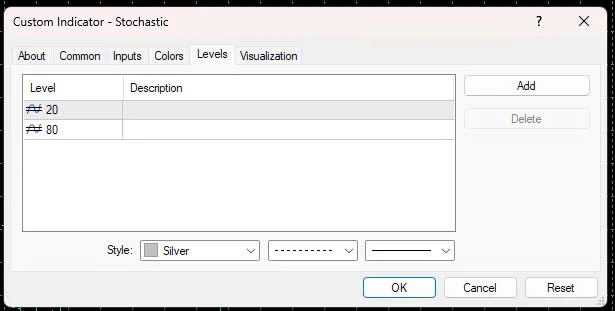
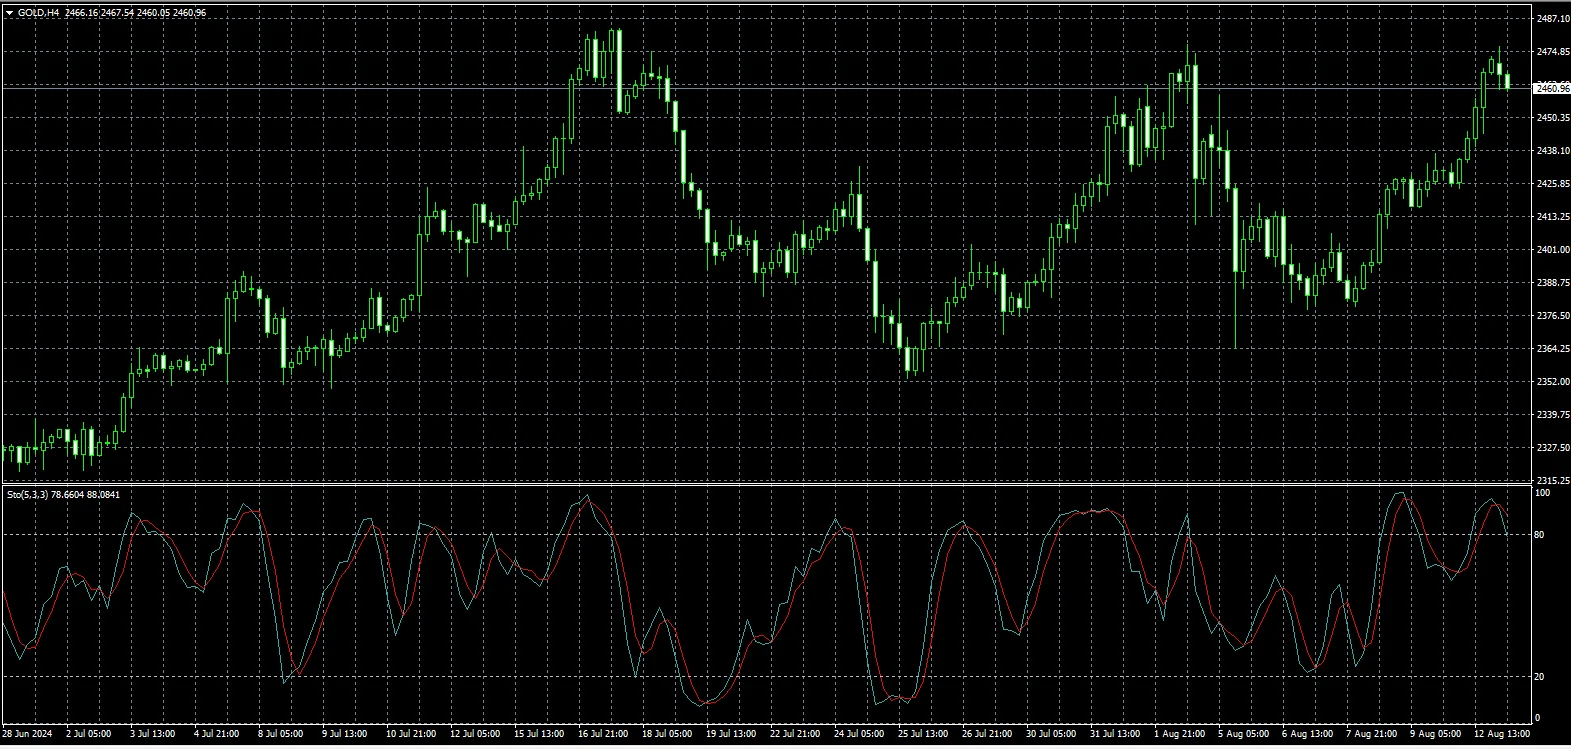
After following these steps, choose OK and Stochastic will be displayed on your MT4/MT5 chart.
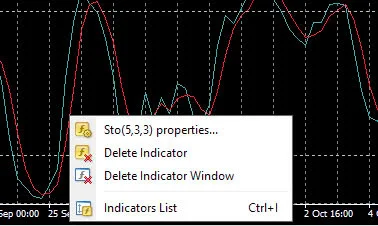
Removing Stochastic:
Right click on the Stochastic indicator chart. Choose "Remove Support Tool" to remove the indicator.
How to display the stochastic indicator on MT4/MT5 on a smartphone
Open the chart in the MT4/MT5 app.
- Tap the "f" icon on the chart and choose "Main Window" from the indicator screen.
- Choose "Main Window" from the indicator screen.
- Select "Stochastic Oscillator" from the "Add Indicator" screen.
- You can use Stochastic without needing to change the settings, just tap the "Done" button.
How to View the Stochastic Indicator
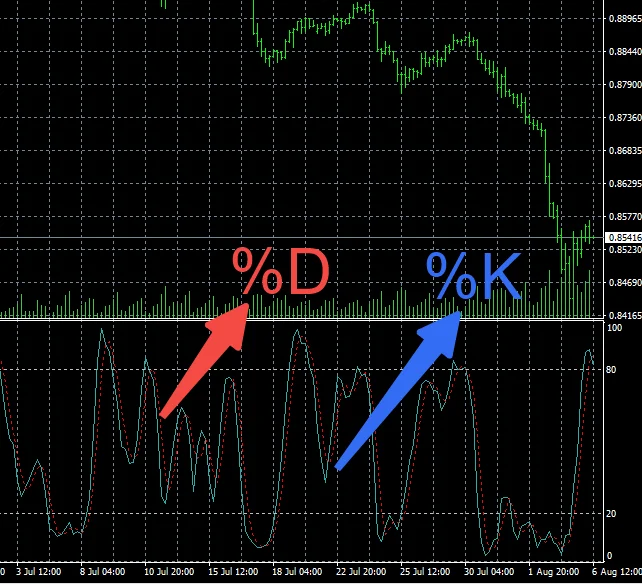
Stochastic appears in the bottom sub-window of the main chart and includes two lines.
The continuous line represents the %K cycle, while the dotted line signifies the %D cycle. Trading decisions are based on the position or intersections of these two lines.
Examples of Trading Using Stochastic MT4
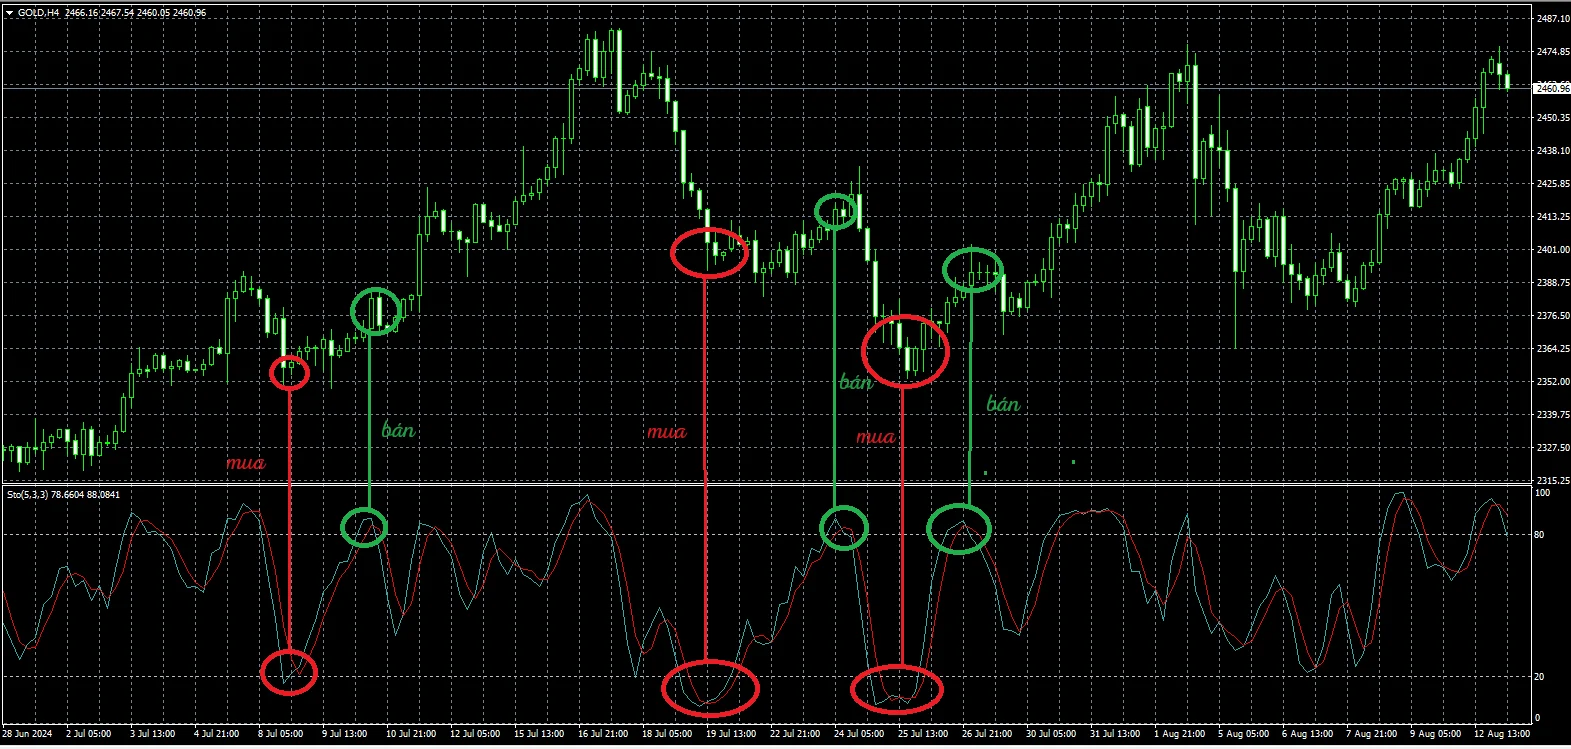
You can decide to buy or sell based on the crossover of the %K and %D ratios, as well as the position of Stochastic at specific ratio levels.
Rather than only relying on popular levels like below 30% (oversold) and above 70% (overbought), you can also apply other levels: below 20% to identify heavy sell points and above 80% to identify heavy buy points.
How to Use Stochastic:
- When both %K and %D are below 30% and %K crosses %D from below upwards, this is a buy signal.
- When both %K and %D are above 70% and %K crosses %D from above downwards, this is a sell signal.
On the chart, buy signals are marked with red circles and sell signals with green circles. Stochastic works well in markets without a clear trend or stable price action. However, the indicator may be less accurate when the market has a distinct trend.
When the market shifts from consolidation to trending, and if you execute quick stop losses, you can combine the MACD indicator to compensate for Stochastic's weaknesses.
Reasons for Using the Stochastic Indicator
In an environment without a clear trend, identifying buy and sell points can be difficult. Therefore, momentum indicators like Stochastics should be used to gauge the level of "oversold" or "overbought".
The chart below shows the combination of MACD and Stochastic. In markets without a clear trend, signals from MACD alone may not be distinct enough, while Stochastics can help identify when the market is "bought up over 70%" and "sold off under 30%."
Stochastics helps traders identify potential buy and sell points based on the overbought or oversold state of the market. Calculating and analyzing the values of %K, %D, and Slow %D provides important information for making effective trading decisions.
.png.webp)
You may also be interested in:
- MT4 vs MT5: Key Differences to Boost Your Trading Efficiency
- Remove XM MT4 Safely: Quick and Easy Removal Process
Stochastic is useful for analyzing markets with clear trends and during periods of low volatility. However, like any other technical analysis tool, it can also generate false signals in unstable market conditions, so risk management and combining with other indicators is important. I hope this helps you confidently apply the Stochastic MT4 indicator in your trading!
However, like any other technical analysis tool, it can also generate false signals in unstable market conditions, so risk management and combining with other indicators is important. I hope this helps you confidently apply the Stochastic MT4 indicator in your trading!


.png.webp)
.png.webp)