.png.webp)
How to Use Parabolic SAR MT4 for Smarter Trend Analysis
Parabolic SAR MT4 is a powerful technical analysis tool that helps traders identify market trends and reversal points. In this post, we will provide a detailed guide on how to use Parabolic SAR on the MT4/MT5 platform, from installation to signal analysis to optimize your trading strategy.
What is Parabolic SAR MT4?
Parabolic SAR is a widely used technical indicator in market analysis to determine trends and potential reversal points. SAR stands for "Stop and Reverse", indicating its main function is to identify stopping loss points and potential market reversal points.
The Parabolic SAR works by plotting a series of dots below (during an uptrend) or above (during a downtrend) market prices. Each new SAR value is calculated based on the previous value and the high-low range over the past few periods.
As the market extends its trend, SAR values will lag further behind prices. But when the trend reverses, SAR will cross over the market price, signaling a potential trend change. Traders can enter positions in the direction of the new indicated trend following a crossover.
The key parameters for Parabolic SAR are acceleration factor (which controls how quickly SAR responds to price changes) and maximum value (limits how far behind prices SAR can trail). Adjusting these factors allows customizing the indicator to different market conditions.
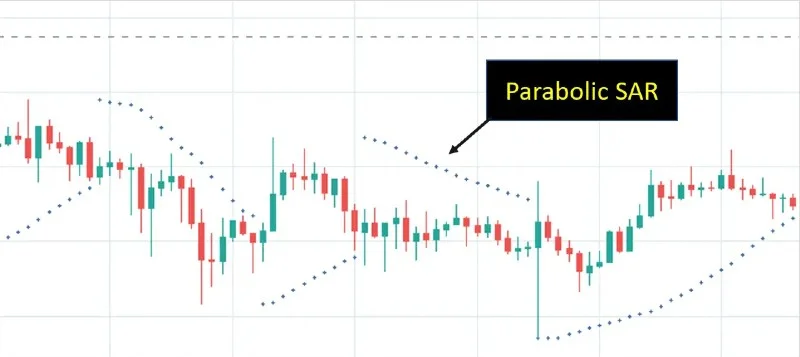
How it works:
Parabolic SAR is represented by a series of dots on the chart.
- When the dots are below the price, it indicates an uptrend.
- When the dots are above the price, it indicates a downtrend.
The dots continuously adjust along the price action, forming a parabolic curve. When the trend changes, the dots will jump across the price line, signaling a potential reversal.
Methods to display Parabolic SAR on MT4/MT5 for PC
To use this indicator, you need to add it to your trading chart. Below are detailed instructions on how to display Parabolic SAR on MT4/MT5:
Step 1: Find the indicator function. There are 3 ways to open it.
Way 1: From the shifting window in the bottom left corner of the screen, choose Index → Trend → Parabolic SAR, drag and drop it onto the chart you want to apply (click and hold the left mouse button → Release mouse)
Way 2: From the toolbar icon, click the + sign → choose Trend → Parabolic SAR
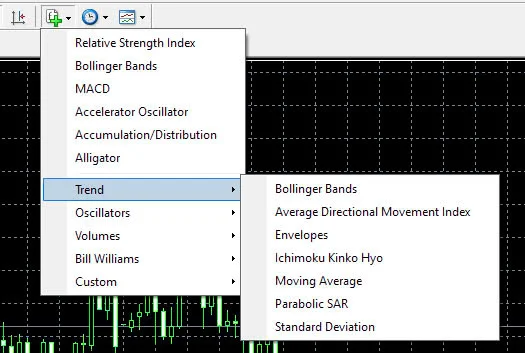
Way 3: From the tool bar, click Add → Support Tools → Trend → Parabolic SAR
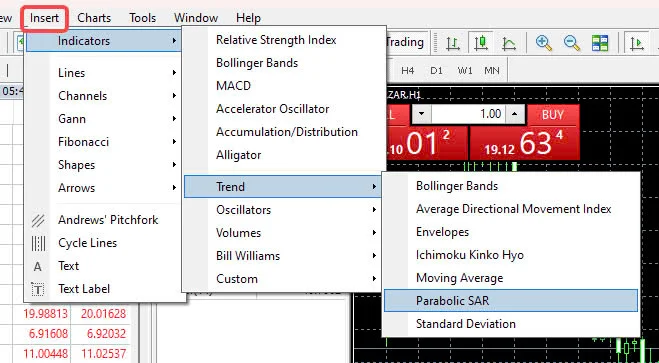
Step 2: A popup window appears on the screen, you can keep the default settings → Click OK.
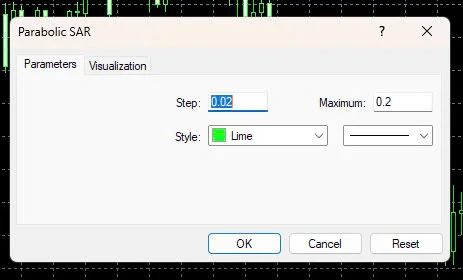
Note: 0.02 is the standard for the "step size" parameter.
When setting the "upper limit" at 0.2 and adjusting this value by gradually increasing the levels 0.02, such as from 0.02 to 0.04, then 0.06... However, note that the higher the value increases, the higher the likelihood of false signals occurring.
Step 3: Done.
Display screen
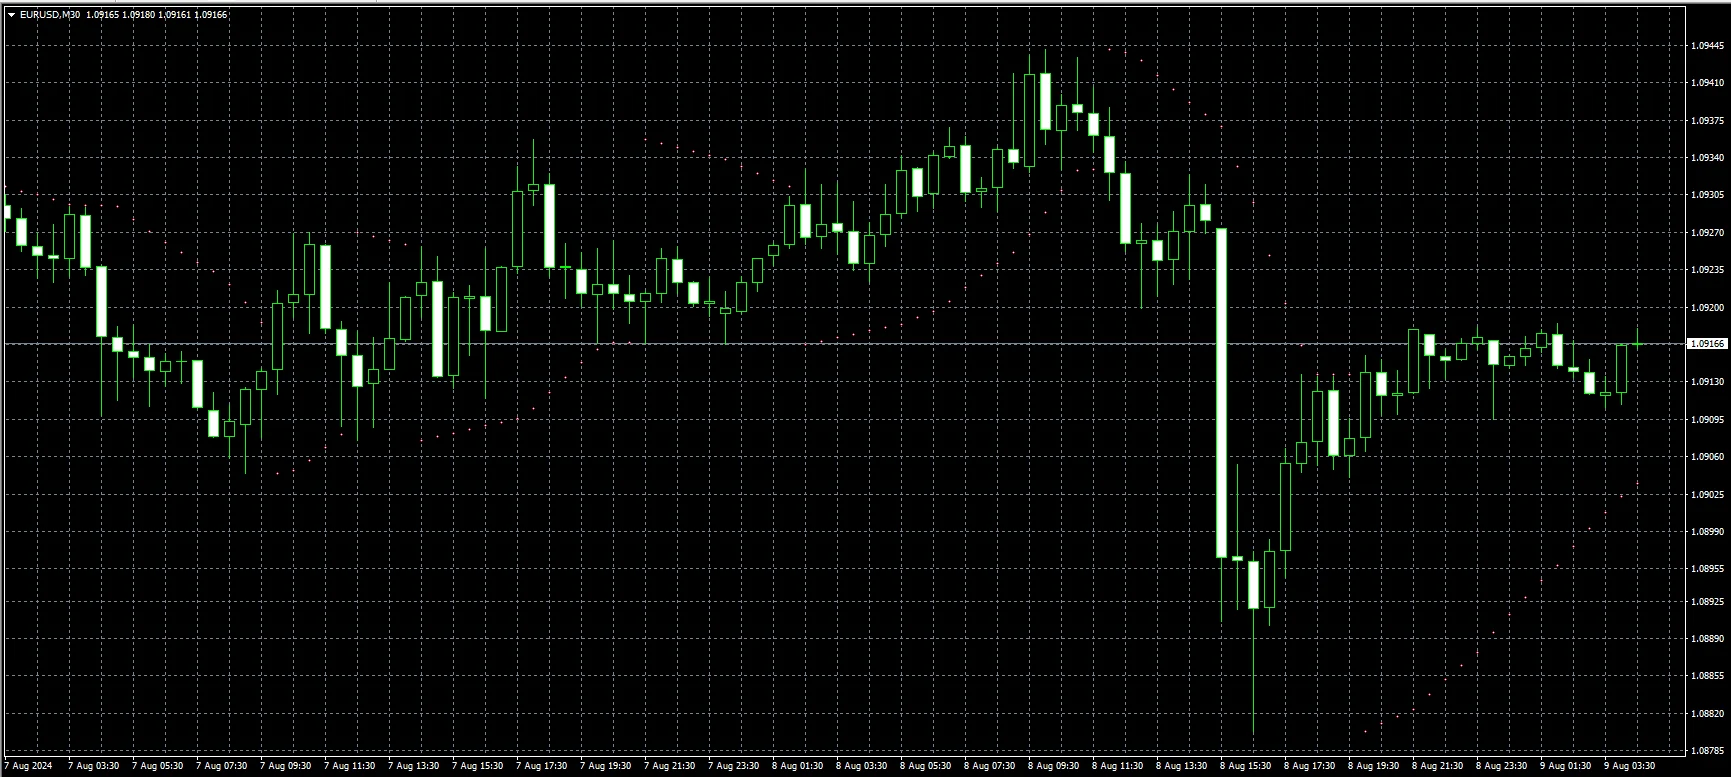
? In case you want to remove the Parabolic SAR indicator from your trading chart to switch to using other indicators or simply want a cleaner chart, you can follow these steps:
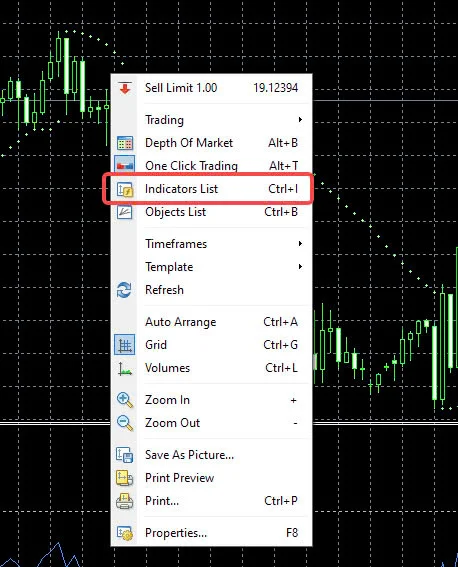
Step 1: Right click on the chart => choose Support Tools
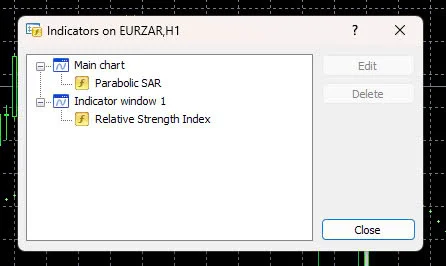
Step 2: Click Parabolic SAR → Delete
Methods to display Parabolic SAR on MT4/MT5 on phones
Displaying the Parabolic SAR indicator on MT4/MT5 apps is quite simple. Here are the detailed steps:
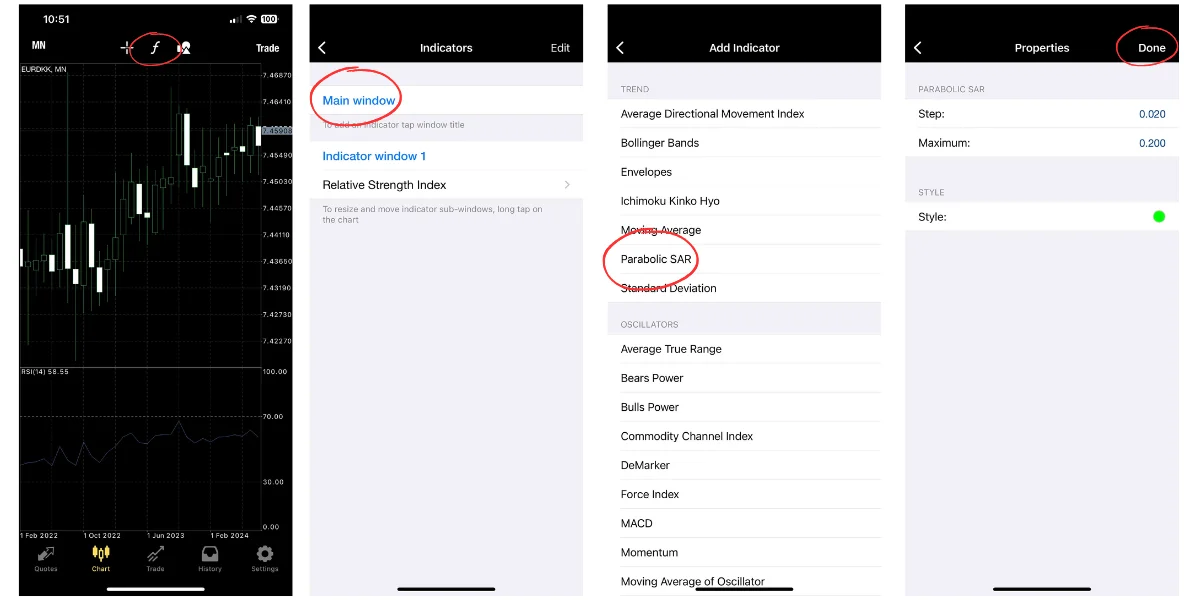
Step 1: Access the chart screen from the 'chart tab' in the MT4/MT5 app, then tap the 'f' icon on the chart.
Next, choose the 'main window' from the indicator screen.
Step 2: Find and select 'Parabolic SAR' on the 'Add Index' screen, and the "Attributes" setting screen will appear.
If you do not need to change the settings, you can tap the 'Done' button to start using Parabolic SAR immediately.
Guide to reading Parabolic SAR MT4
To fully understand and effectively apply the Parabolic SAR indicator in trading, it is very important to grasp how to read and analyze its signals. Parabolic SAR, with its ability to provide information about market trends and reversal points, can help you make more accurate trading decisions.
- Upward trend: When the dots are below the price, the market is in an upward trend. You can consider opening a buy order.
- Downward trend: When the dots are above the price, the market is in a downward trend. You can consider opening a sell order.
- Recognize the trend changes at the point where the Parabolic SAR and price intersect (The point where the parabola changes from displaying the price above and below).
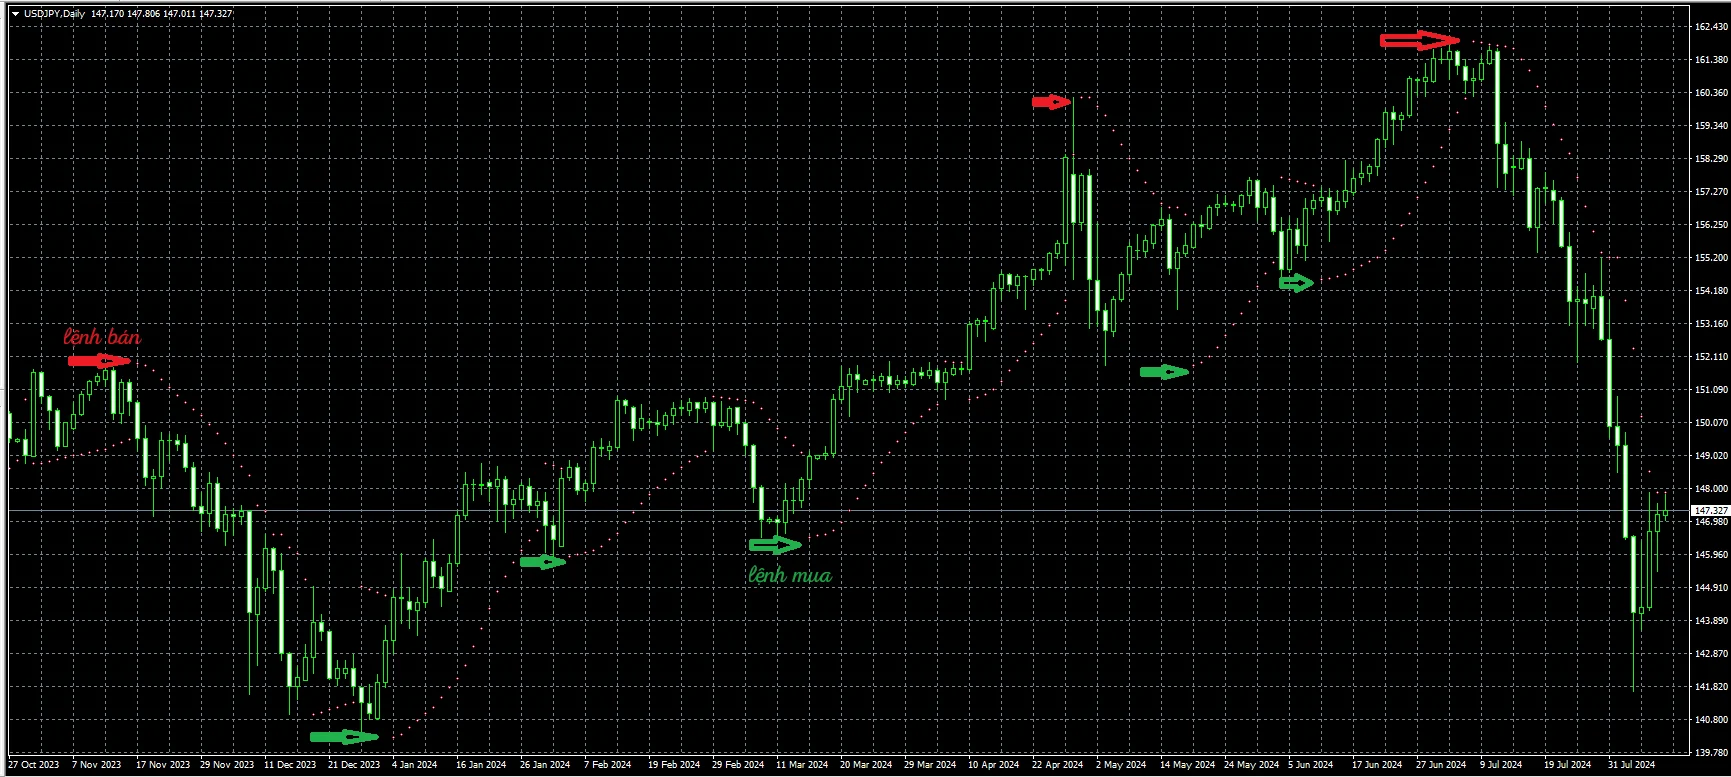
When the parabola changes direction:
- Below the price => place a buy order
- Above the price => place a sell order
.png.webp)
Also, when the parabola changes direction, it means the price trend is changing, you can predict the time to close existing orders at this point.
Important note: Parabolic SAR is a trading decision support tool, not the only trading signal. Buying/selling decisions should be based on many other factors such as market news, other technical indicators, and personal experience.
See also:
- Boost Your Trading Strategy with MACD MT4 Indicator Setup Guide
- RSI MT4 Guide: Maximize Profits with Precision Trade Signals
Properly applying the Parabolic SAR method on MT4/MT5 platforms can help improve your trading strategy and risk management effectively. By firmly grasping the entry and exit signals, along with monitoring the SAR dots, you can maintain profits and minimize losses. I hope this information has helped you understand Parabolic SAR MT4 most clearly.


.png.webp)

.png.webp)