.png.webp)
RSI MT4 Guide: Maximize Profits with Precision Trade Signals
In this article, we will explore how to apply the RSI MT4 indicator to optimize stock trading strategies, from identifying trends to making accurate trading decisions.
What is the RSI indicator?
RSI (Relative Strength Index) is a widely used technical analysis tool to measure momentum and identify overbought or oversold conditions of an asset. RSI helps investors assess the relative strength of the up and down markets within a certain period of time.
RSI calculation formula: RSI = 100 - 100/(1 + RS)
Where: RS is the relative strength, calculated as the average total rising days divided by the average total falling days within a certain period of time. (RS = AG/AL);
How RSI works:
- Value: RSI fluctuates between 0 and 100.
- Overbought and oversold levels:
- Overbought: When RSI exceeds 70, it indicates the market is overheated and a downward correction may occur soon.
- Oversold: When RSI falls below 30, it indicates the market is oversold and an uptrend may occur soon.
- Divergence: When RSI and price move in opposite directions, it is a divergence signal, indicating the current trend may be weakening and a trend reversal may occur soon.
How to display RSI MT4/MT5 on PC
To use RSI, you need to add it to your trading chart. Here are detailed instructions on how to display RSI on the MT4/MT5 platform:
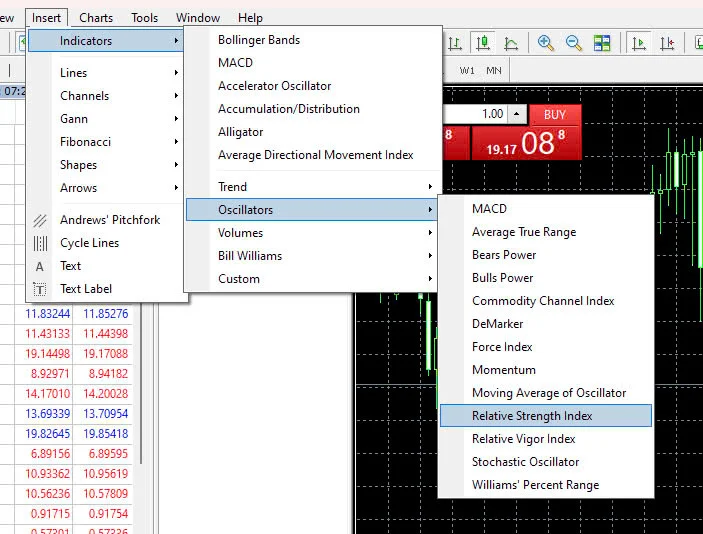
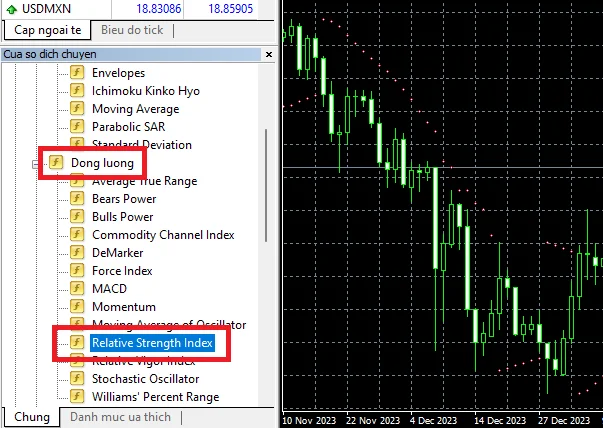
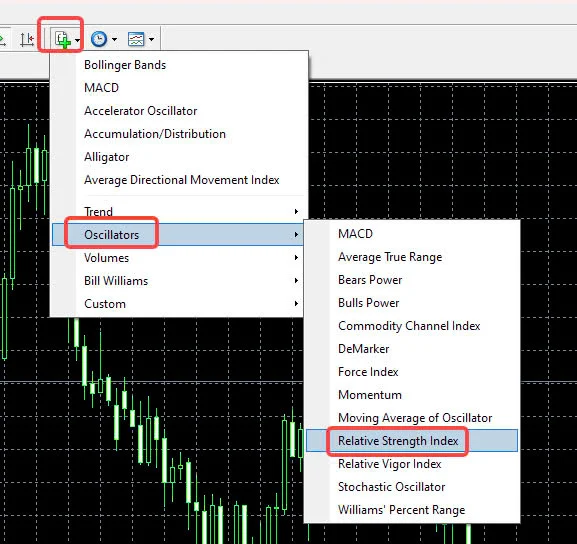
Step 1: Find the indicator function. There are 3 ways to open:
- Way 1: From the toolbar, click Add -> Supporting Tools -> Momentum -> Relative Strength Index
- Way 2: From the window shifter in the bottom left corner of the screen, select Index -> Momentum -> Relative Strength Index, drag and drop it onto the chart you want to apply (left click and hold -> release).
- Way 3: From the icon toolbar, click the + icon -> select Momentum -> Relative Strength Index
Step 2: The RSI setup window will pop up, but you can use the indicator directly with the default settings (standard). If you want to adjust, you just need to change the two main parameters of "period" and "style".
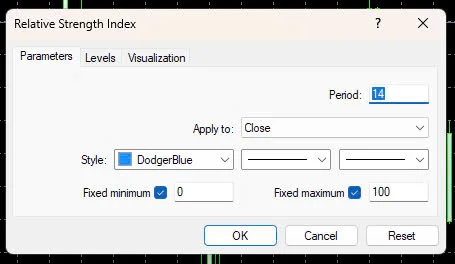
The RSI developer recommends using a 14-day period when applying to daily charts. You can adjust the period to match the period of the moving average line you normally use if applying RSI to other time frames.
You can also set colors for the 30 and 70 levels in the "level" tab of the settings for easier observation (not required).
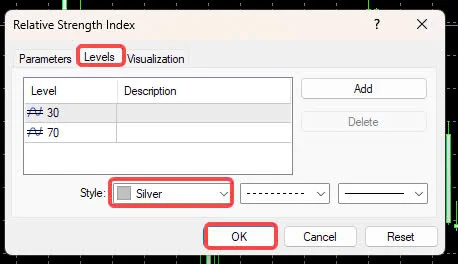
Step 3: Finish
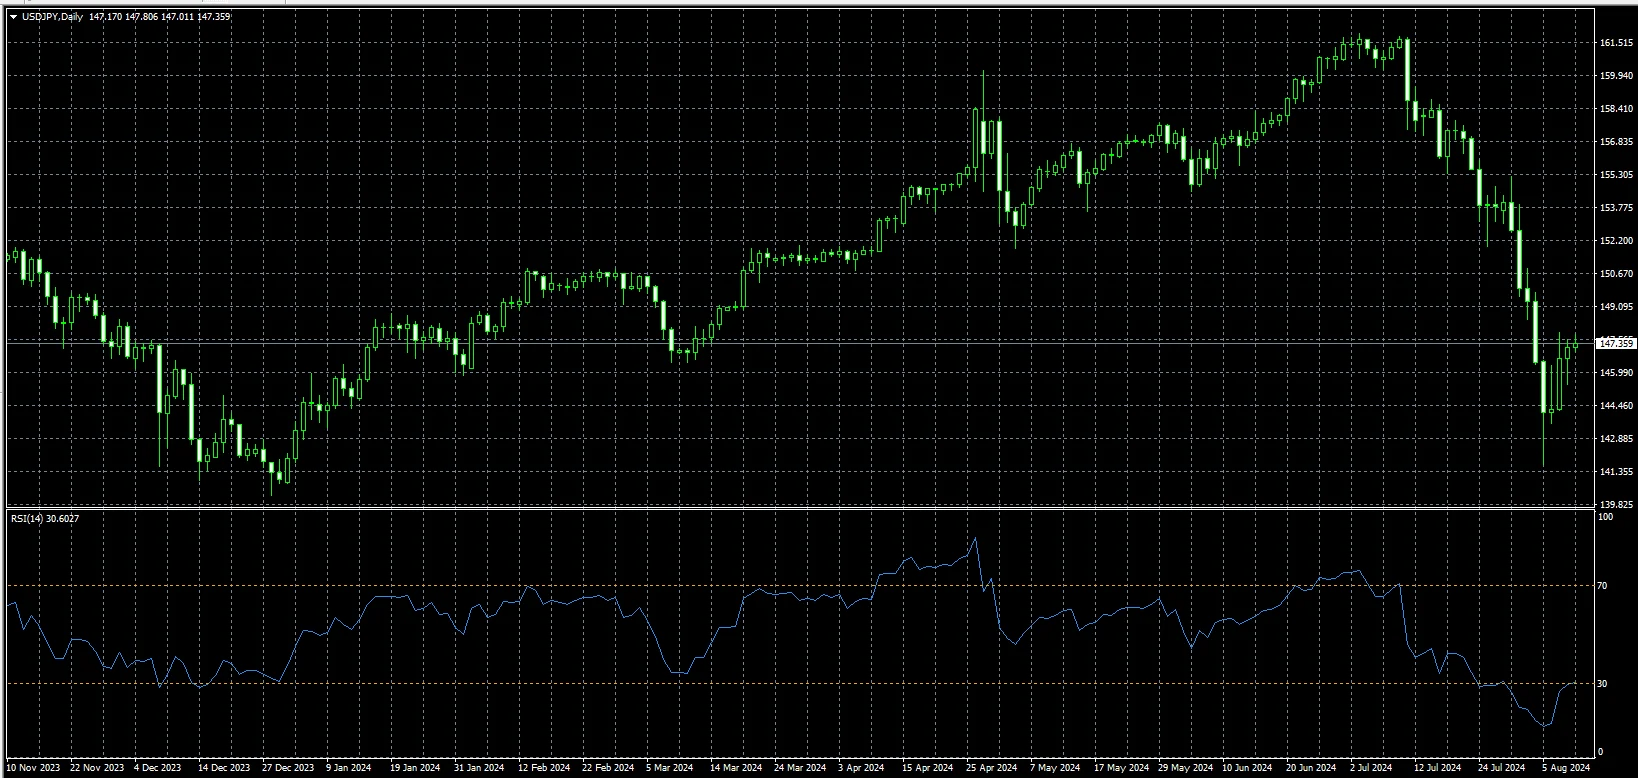
The chart will then display the RSI indicator.
In case you want to remove RSI, you can right click -> Supporting Tools -> choose Relative Strength Index -> Delete.
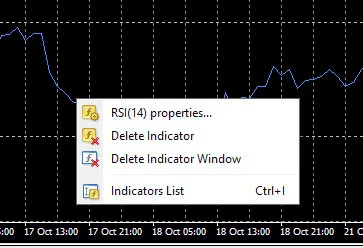
How to display RSI MT4/MT5 on phone
Being able to monitor it directly on your phone will help you seize trading opportunities anytime. Here are detailed instructions to display RSI on MT4/MT5 mobile apps:
Access the chart from the "Chart" tab in the MT4/MT5 app, then tap the "f" icon on the chart. Next, select "Main Window" from the index menu.
Find and tap "Relative Strength Index" under Momentum on the "Add Index" screen, then the "Properties" setting screen will appear.
.png.webp)
Since RSI can be used with default settings, you just need to tap the "Finish" button to complete it.
? If you no longer need to use RSI, removing it is also very simple. Just swipe the index name left, the delete button appears => tap the delete button.
Applying the RSI MT4 indicator in trading
Trading methods that use RSI can be divided into the following 3 ways of using:
Trading based on 30% and 70% level breaks
Trading based on the 30% and 70% levels of the RSI (Relative Strength Index) indicator is often used to identify overbought or oversold conditions in the market.
Understanding the 30% and 70% RSI lines:
- 30% line: Marks the oversold area. When RSI falls below 30, it means selling pressure is too strong and prices may soon reverse higher.
- 70% line: Marks the overbought area. When RSI exceeds 70, it means buying pressure is too strong and prices may soon reverse lower.
.png.webp)
Trading standard based on RSI
- Above 70% is "bought too much" = Sell
- Below 30% is "sold too much" = Buy
Divergence trading method
Divergence is an important concept in technical analysis, especially when combined with the RSI indicator. It shows a desynchronization between price and momentum, often a precursor to trend reversals.
Understanding RSI Divergence:
- Positive divergence: When the new low is lower for prices but higher for RSI, it is a positive divergence signal, indicating an upside reversal potential.
- Negative divergence: Conversely, when the new high is higher for prices but lower for RSI, it is a negative divergence signal, indicating downside reversal potential.
.png.webp)
When divergence occurs in the market, this often indicates that the current trend may be about to end and a reversal is possible.
If prices are in a downward trend and divergence occurs, this may indicate prices are about to rise again. Conversely, if prices are in an uptrend and divergence occurs, this may signal prices will soon fall.
Trend line drawing method on RSI
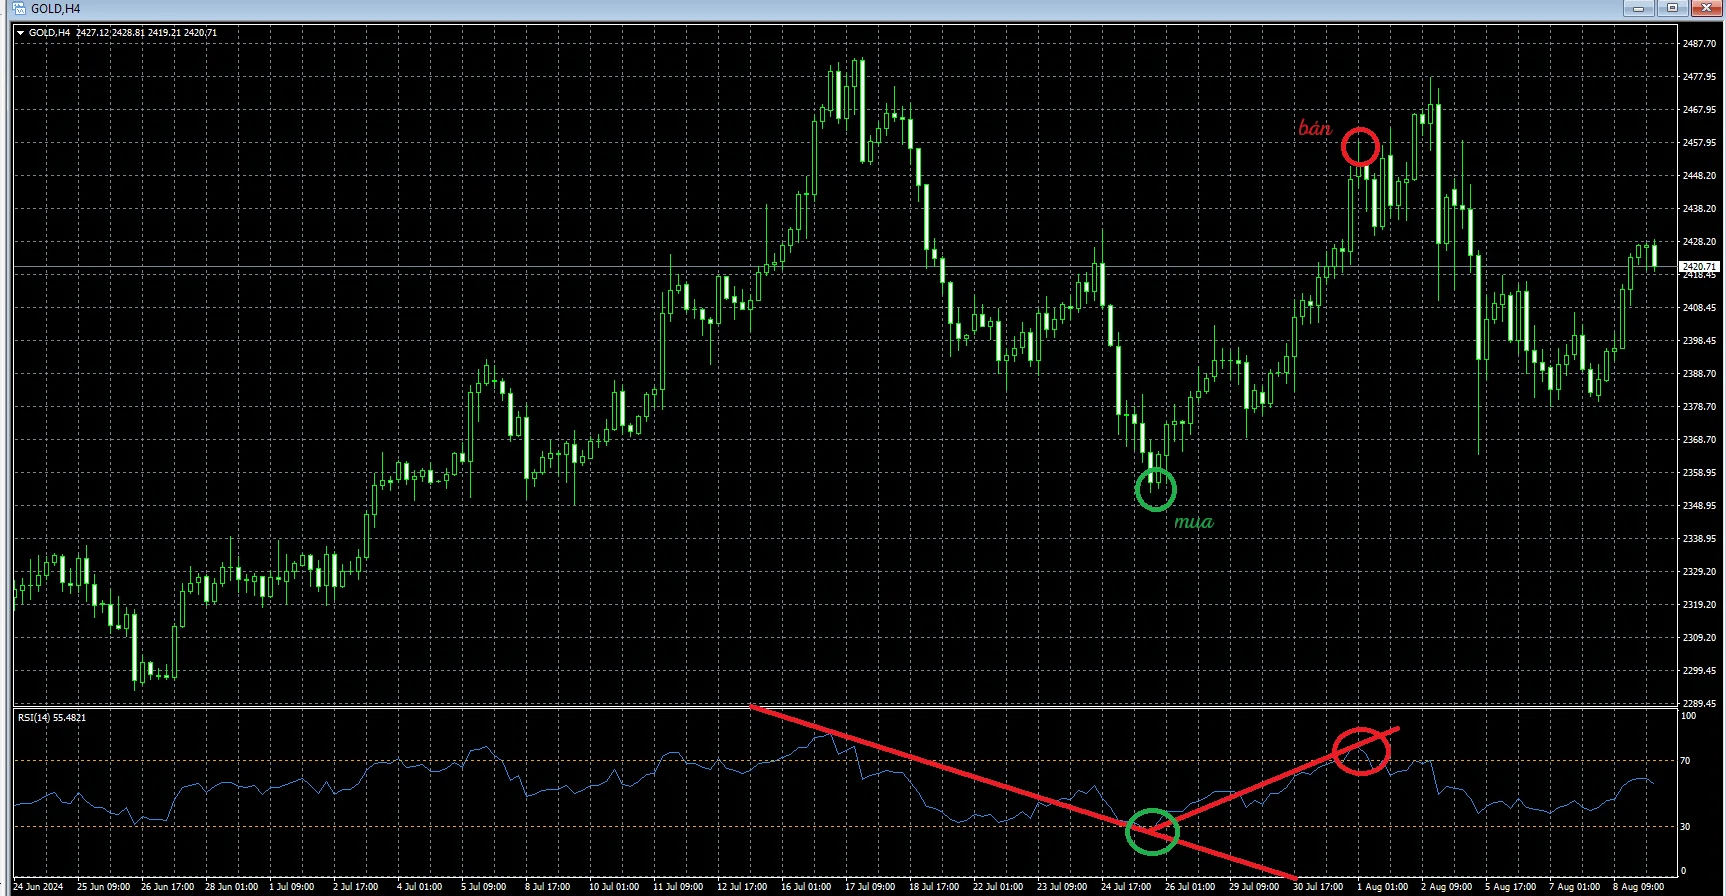
By drawing trend lines on the RSI chart, investors can identify the support and resistance zones of RSI to make appropriate trading decisions.
Since trend lines act as resistance and support lines, buy orders are placed when the RSI MT4 index rises and breaks above (the green circled line on the chart) the downward trend line and sell orders are placed when the RSI index falls and breaks the upward trend line (the red circled line).
Advantages and disadvantages of RSI
We all know RSI has many advantages and supports trading a lot. However, it also has certain disadvantages:
Advantages:
Simple and easy to understand
Identifies overbought and oversold zones to help investors make decisions
Detects divergences
Applicable to various timeframes, from short to long term.
Can be combined with other technical indicators to increase signal accuracy.
Disadvantages:
A limitation of RSI is the difficulty in accurately identifying trading signals in strong trending markets. When prices continuously rise or fall, RSI tends to remain in overbought or oversold zones for extended periods, reducing the reliability of reversal signals.
.png.webp)
Buy signal if RSI is below 30% and considered too oversold
Sell signal if RSI is above 70% and considered too overbought
Buy/sell signals can also be evaluated by drawing trend lines on RSI.
Effective in volatile markets, less so in strong trending markets.
Combine with other indicators to increase accuracy.
You may also be interested in:
- How to Use Horizontal Line MT4 for Accurate Market Analysis
- Moving Average MT4 - A Key Tool for Smarter Trading
Applying the RSI indicator in stock trading can help you identify potential buy and sell points based on overbought or oversold market conditions. By combining RSI MT4 with other analytical tools, you can optimize your trading strategy and manage risk more effectively.


.png.webp)
.png.webp)