.png.webp)
Guide Trend Line MT4: Improve Entry and Exit Point Precision
Trend line on MT4 is a simple but effective tool for market trend analysis and prediction. Understanding how to draw and apply Trend lines will help traders predict potential entry and exit points. This article from Smartlytrading will guide you on how to draw and apply trend lines in trading on MT4. Let's take a look!
Guide to Display Trend Line on MT4/MT5
Trend line is an important technical analysis tool that helps traders determine the direction of the market and predict potential entry and exit points. To draw and use trend lines on the MetaTrader 4 (MT4) and MetaTrader 5 (MT5) trading platforms, follow the instructions below.
Displaying Trend Lines on MT4/MT5 for PC
Step 1: Open the Chart
Open the MT4/MT5 platform and select the chart of the asset you want to analyze.
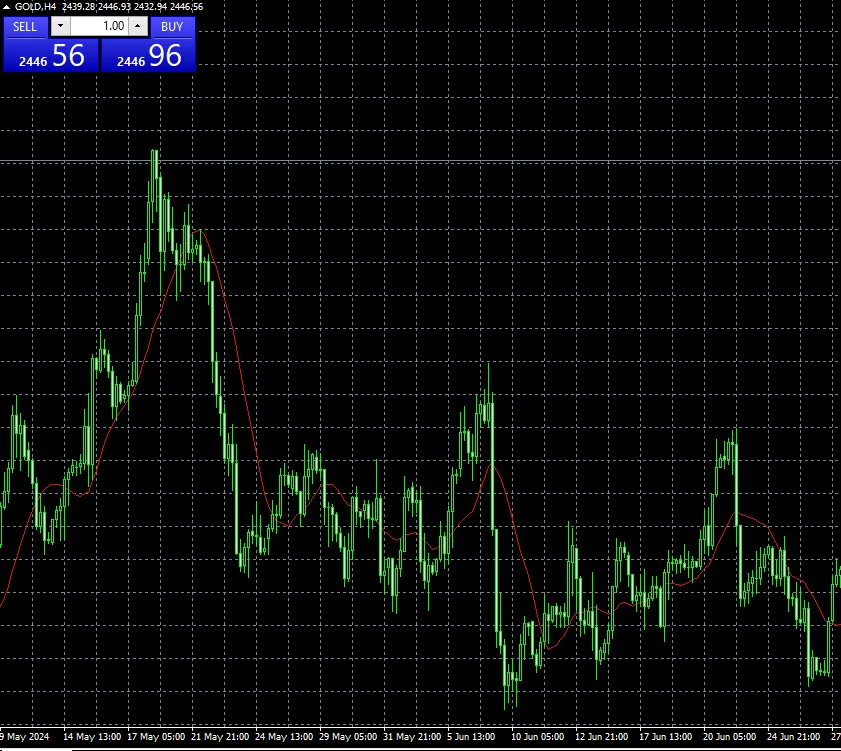
Step 2: Select the Trend Line Tool
On the toolbar, click on the trend line icon (or select from the "Insert" menu -> "Trend Line").
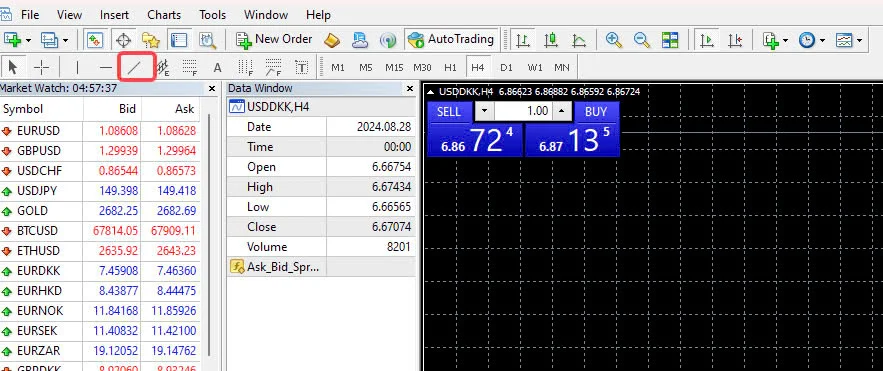
Step 3: Draw the Trend Line
For an uptrend: Click and hold the left mouse button to connect the closing prices of candles. Release the mouse button to complete it after selecting the start and end points.
For a downtrend: Click and hold the left mouse button to connect the high prices of candles. Release the mouse button after selecting the start and end points.
Step 4: Adjust the Trend Line
To move or change the length of the trend line, double click on the trend line to display the adjustment points. When the lines have white marked points, you can drag the points to adjust as desired.
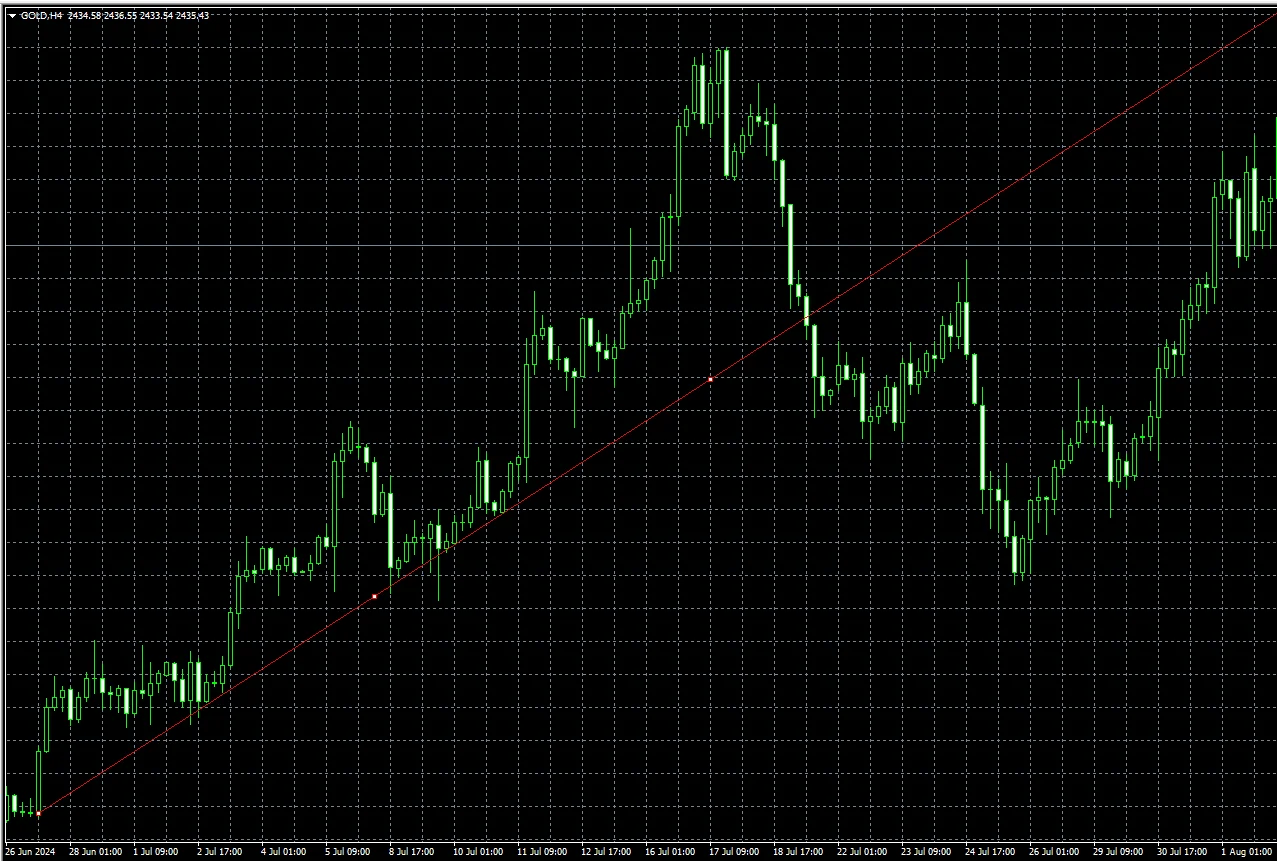
Step 5: Change Trend Line Properties
Right click on the trend line to open the option menu. In Trendline properties, you can adjust the color, length, line style, etc.
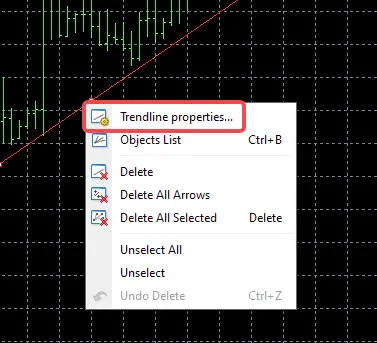
Step 6: Delete the Trend Line
To delete a trend line, right click on it and select "Delete".
How to Display Trend Line MT4/MT5 on Smartphone
Step 1: Open the Chart
Open the MT4/MT5 app on your smartphone and select the chart of the asset you want to analyze.
Step 2: Select the Trend Line Tool
Tap the illustration icon on the chart screen, then select the trend line icon from the tool menu.
Step 3: Draw the Trend Line
Touch and hold on the chart to draw the trend line. For uptrend, draw from closing price highs to lows. For downtrend, draw from closing price lows to highs.
Step 4: Adjust the Trend Line
After drawing, you can move and adjust the length of the trend line by touching and dragging the adjustment points.
Step 5: Change Trend Line Properties
To change the color or thickness of the trend line, touch it and select "Settings" from the menu.
Step 6: Delete the Trend Line
To delete a trend line, press and hold on it and select "Delete" from the menu.
Step 7: Delete All Objects
If you want to delete all objects on the chart, tap the trash icon and select "Delete all".
Tips for Drawing Accurate Trend Lines
Set the Starting Point at the Closing Price
When drawing trend lines, it is important to set the starting point of the line at the candle's closing price. This helps ensure higher accuracy than setting the trend line at the shadow (high or low price). Since the closing price reflects the market consensus at that time, it provides a more stable reference point to determine the trend.
Display Trend line MT4 Using Line Chart
When facing difficulties in seeing the starting point of the closing price on the candlestick chart, switch to the line chart. The line chart makes it easier to identify and draw trend lines as it only displays the closing price, reducing clutter and making trend line drawing more visual.
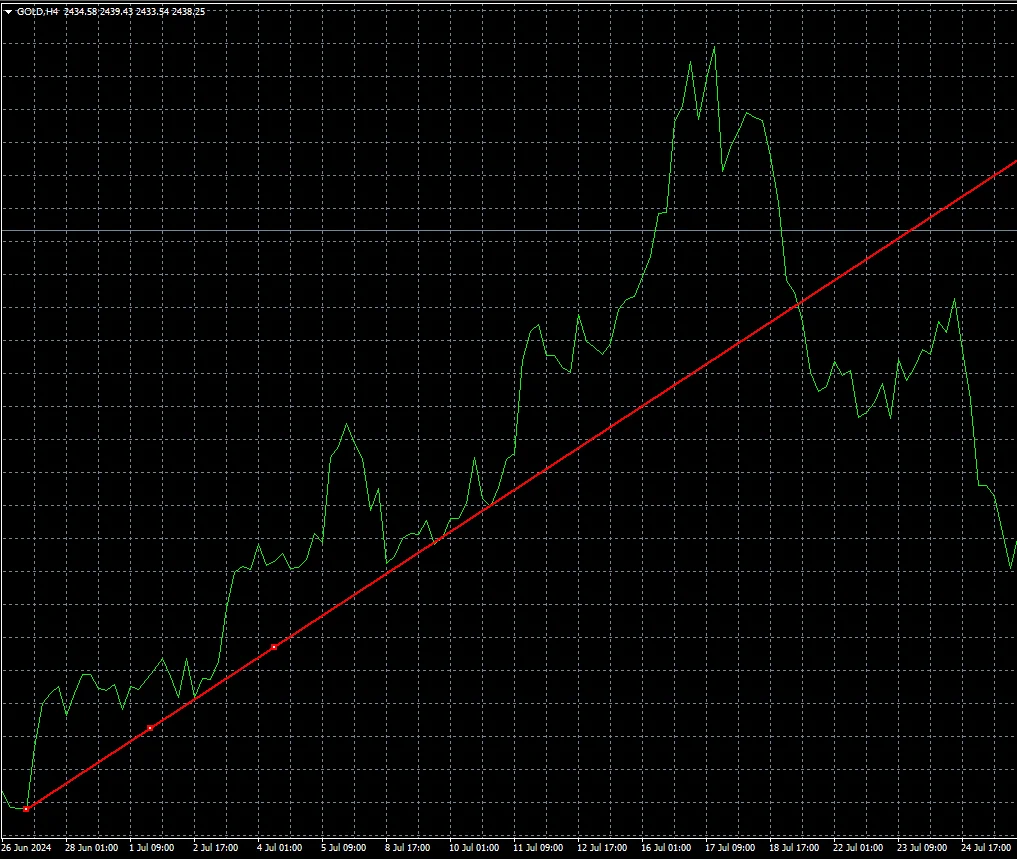
Determine the Strength of the Trend Line Through Price Fluctuations
Trend line MT4 can be analyzed based on the shape of price fluctuations. When price movement forms a tilted "N" shape, the resistance and support of the trend line become stronger.
- Large "N" shape: Indicates high volatility. This means the trend may be strong and easy to continue.
- Small "N" shape: Indicates low volatility. The trend may be less strong and more likely to stop or change direction.
The Importance of the Size and Shape of the “N”
The size and shape of the "N" on the chart can affect the probability of the trend continuing. When successive "N" shapes are uniformly sized and beautifully formed, it indicates that price fluctuations tend to continue increasing or decreasing.
Applying this accurate trend line drawing method will help you gain a clearer insight into market trends and make more effective trading decisions.
Guide to Using Trend Lines for Trading Analysis
Trend Line Analysis
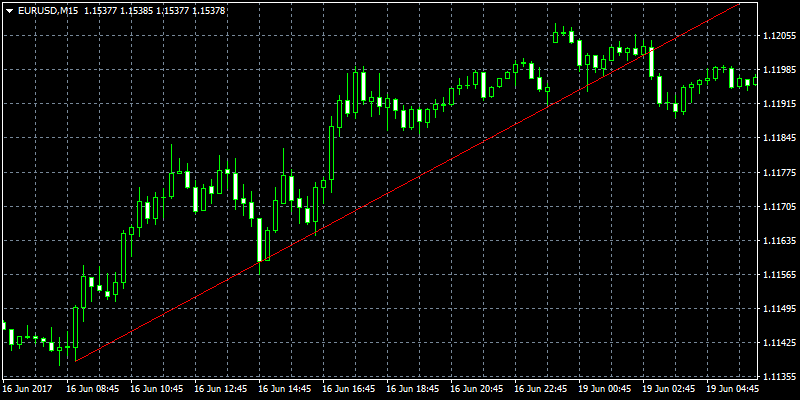
Uptrend: When the market is in an uptrend, prices will typically be above the trend line. At points where the price drops and touches the trend line, there is a possibility of prices continuing to rise. In this case, you can enter a "buy" order (look for lower prices) when prices temporarily drop while the main trend is still rising.
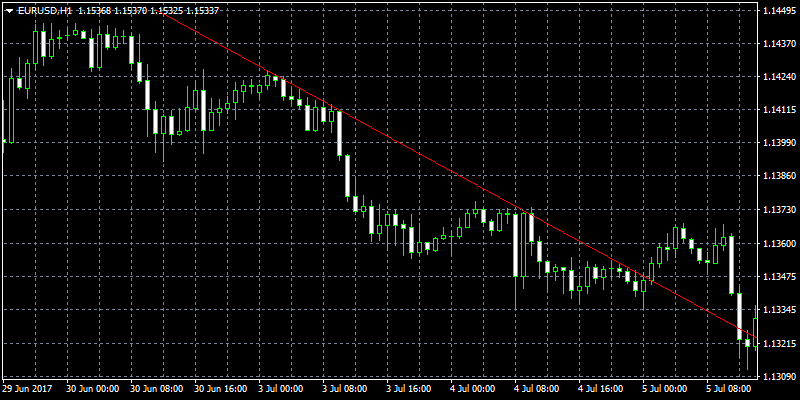
Downtrend: In a downtrend, prices will typically be below the trend line. When prices rise and touch the trend line, a further price drop can be predicted. Therefore, you can enter a "sell" order at points where prices rise temporarily within the downtrend to take advantage of the subsequent price decline.
Trading Examples
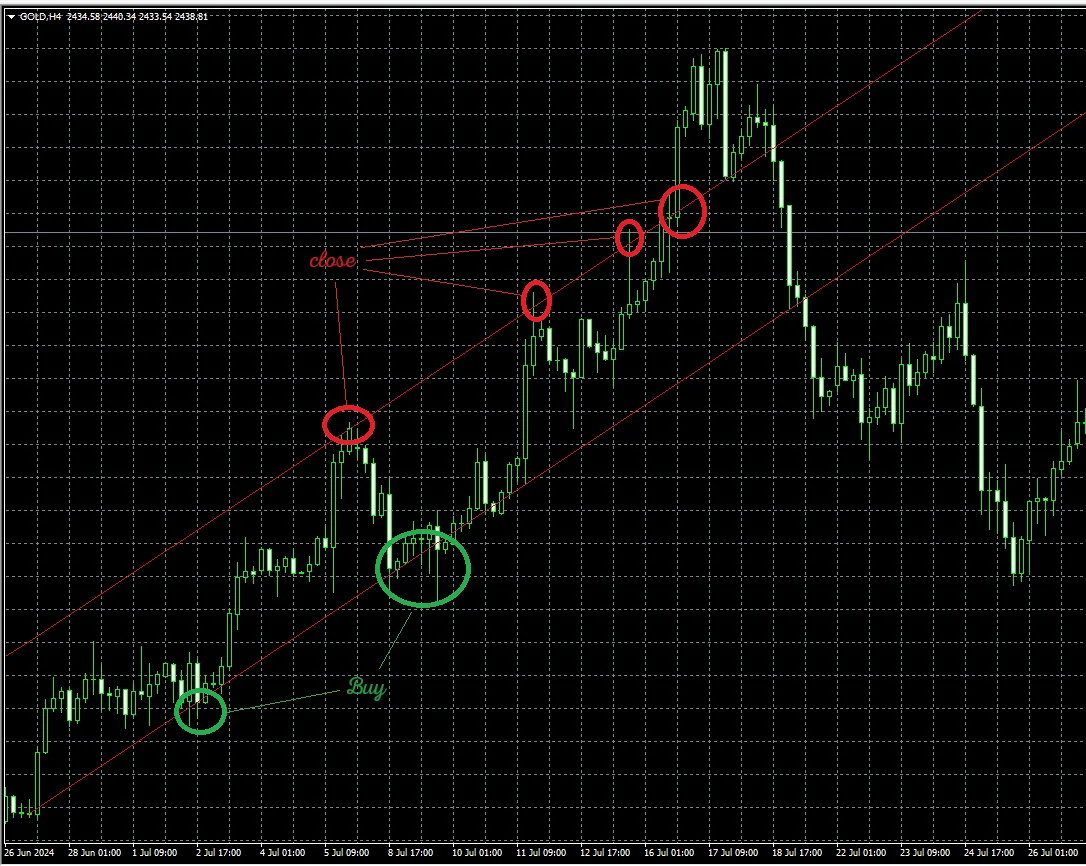
Uptrend Trade: On the chart, if the price is in an uptrend and touches the trend line, you can place a buy order near the trend line when prices drop. The take profit point can be determined when prices approach another channel line drawn parallel to the main trend line.
Downtrend Trade: Conversely, in a downtrend, you can place a sell order when prices rise temporarily near the trend line. Take profit when the price touches another parallel channel line.
Using Channel Lines
Drawing Channel Lines: A channel line is an automatic tool that draws another trend line parallel to the main trend line. To draw a channel line in MT4/MT5, select the "E" icon in the menu toolbar and draw it similarly to drawing a trend line.
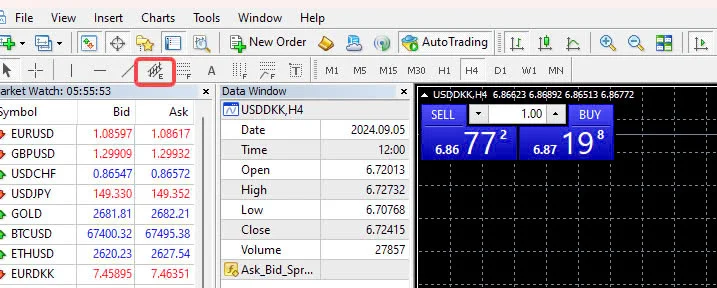
Taking Profit: You can close orders when prices touch the trend line or channel line. For buy orders, take profit when prices touch the uptrend. For sell orders, take profit when prices touch the downtrend.
Analyzing the Width
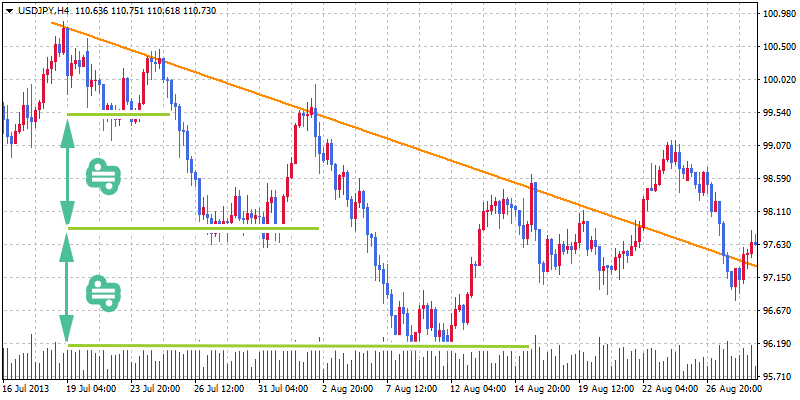
Trend Width: When a trend is rising or falling, the width between highs and lows can be nearly equal. By drawing horizontal lines at each decreasing and increasing width, you can visually observe and predict stopping points of declines in a downtrend or stopping points of rises in an uptrend.
Trading Strategy
Counter-trend Trade: If you see a halting point of declines in a downtrend, you can set up a counter-trend buy strategy at that point.
Close Existing Sells: In a downtrend, if prices stop declining, you can close existing sell orders to secure profits.
In summary, using trend lines to judge buy and sell points is a useful approach to determine entry and exit timings based on price interaction with trend lines and channel lines.
Guide to Trading at Trend Change Points
When the price breaks above or below the trend line, there may be a change in the current trend, reversing in the opposite direction.
An effective trading method in this case is to base it on the price breaking out of the trend line to determine when the trend changes.
Predicting trend changes using multiple trend lines
To predict trend changes, you should consider multiple different trend lines. However, due to possible price fluctuations that make you think the price has broken the trend line, combining multiple lines and providing an overall analysis is necessary.
For example, in the chart you may see a "downtrend line", "horizontal line" and "uptrend line" on the same chart.
.png.webp)
The downtrend cannot follow the uptrend because prices are updated as they fall.
Therefore, when an uptrend line can be drawn, you should consider strategies like "avoid placing sell orders" or "close orders at the point where the three lines intersect (can cut losses depending on the situation)" or "place buy orders and close sell orders at that point".
Predicting when the support and resistance lines of a trend line change
When the support and resistance lines of a trend line change, you need to pay attention to Trend line MT4.
In the chart image below, the initial uptrend line originally acted as support, but when the price broke below the trend line, it became resistance.
.png.webp)
When a trend line changes from a support role to a resistance role, it indicates that the uptrend may be ending.
At this change point, if you are holding a position, possible strategies are "close positions when support and resistance lines change (can cut losses depending on the situation)" or "place buy orders and close sell orders or vice versa".
Predicting Trading Patterns After a Trend Reversal
After support and resistance lines change, there are three possible price fluctuation patterns: "become the opposite trend", "become a ranging market (market with a certain fluctuation range)" and "trend continues after a period of time".
You can predict the price fluctuation pattern by drawing indicators such as moving averages and horizontal lines on the chart.
.png.webp)
The chart above shows a "horizontal line", "MA25 moving average" and "uptrend line".
Looking at the marked candle:
- Below the uptrend line
- Below the horizontal line
- Below the MA20
=> Temporarily predicts a reversal into a downtrend.
You may also be interested in:
- MT4 vs MT5: Key Differences to Boost Your Trading Efficiency
- Remove XM MT4 Safely: Quick and Easy Removal Process
Conclusion
Drawing and using trend lines on MT4/MT5 is a basic but very important technical analysis skill. By getting familiar with the drawing, adjusting and managing trend line steps, you can improve your market analysis abilities and make smarter trading decisions. Practice drawing Trend line MT4 regularly to enhance your skills and strengthen your trading strategies.


.png.webp)
.png.webp)