Indicators MT4 for Accurate Trade Analysis and Profits
Indicators MT4 are indispensable trading tools for Forex trading. MT4 provides many types of forex indicators with different characteristics and functions. Having a good understanding of these indicators will significantly help traders in more accurately determining market trends.
If you are interested in MT4 indicators, please read the following article. I will introduce 9 of the most popular MT4 indicators currently used in trading.
Top 9 popular and effective indicators MT4 for trading
Indicators on MT4 are very popular due to their diversity. Below are 9 available and most popular indicators currently:
1. Trend line
A trendline is a technical analysis tool that helps traders easily identify whether prices are moving up or down. In an uptrend, the trendline acts as a support level, while in a downtrend it can act as a resistance level. When the price breaks the trendline (breakout), this may indicate a reversal of the current trend.
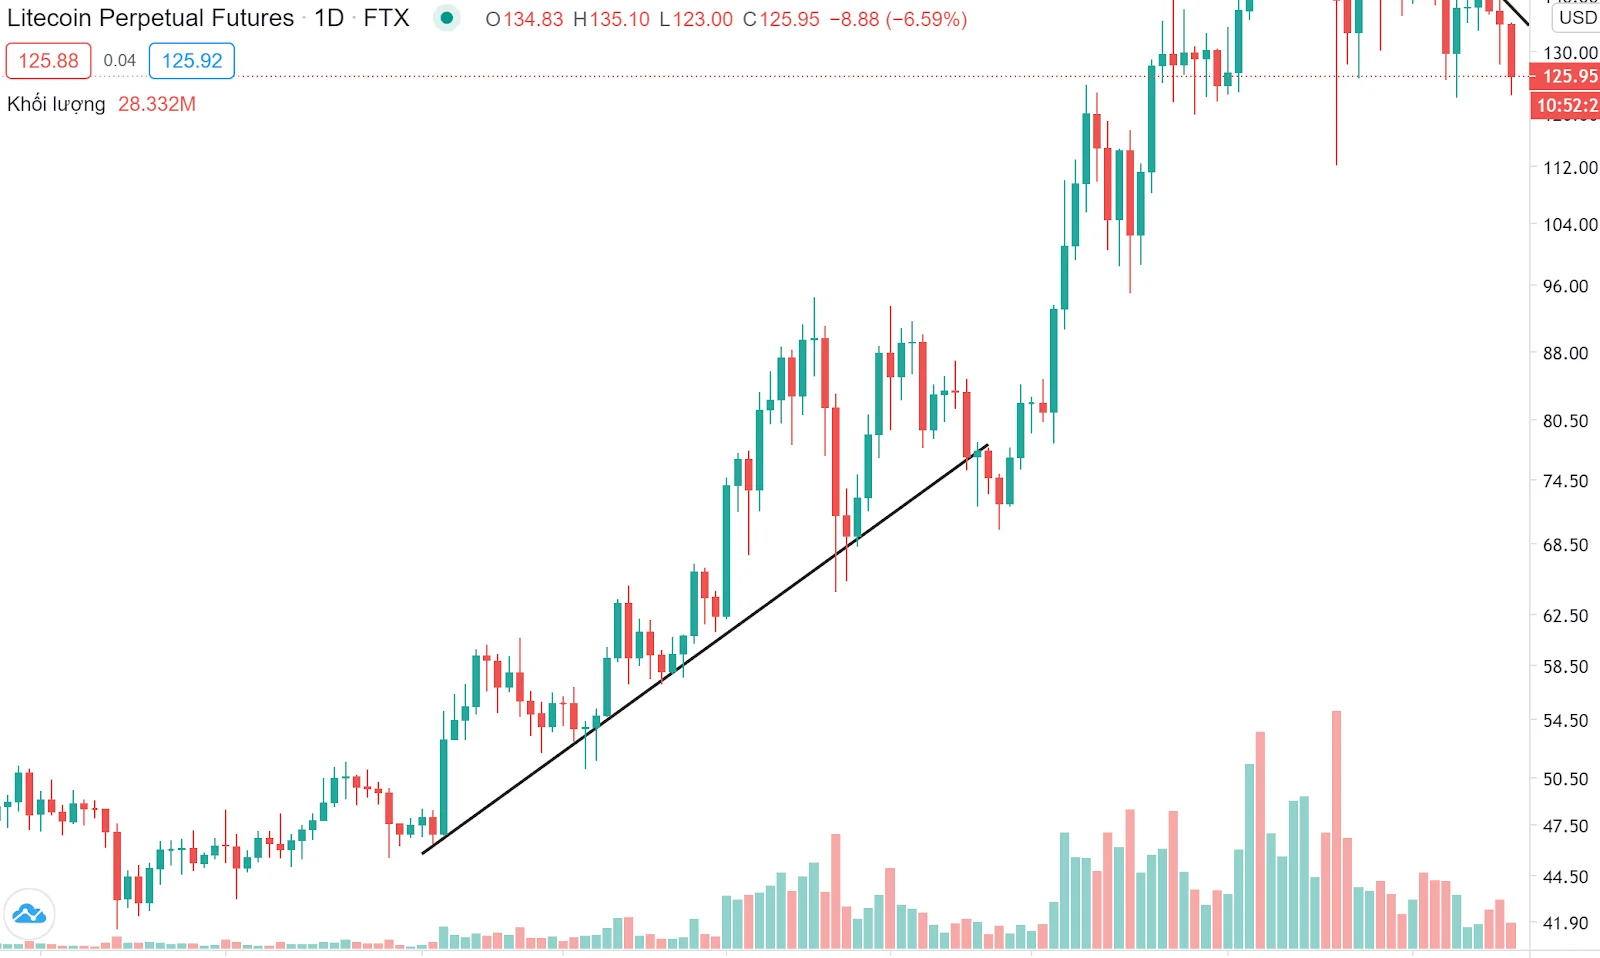
A trendline is a straight line connecting important price points on the chart (lows or highs), indicating the direction of price movement over a specific period of time.
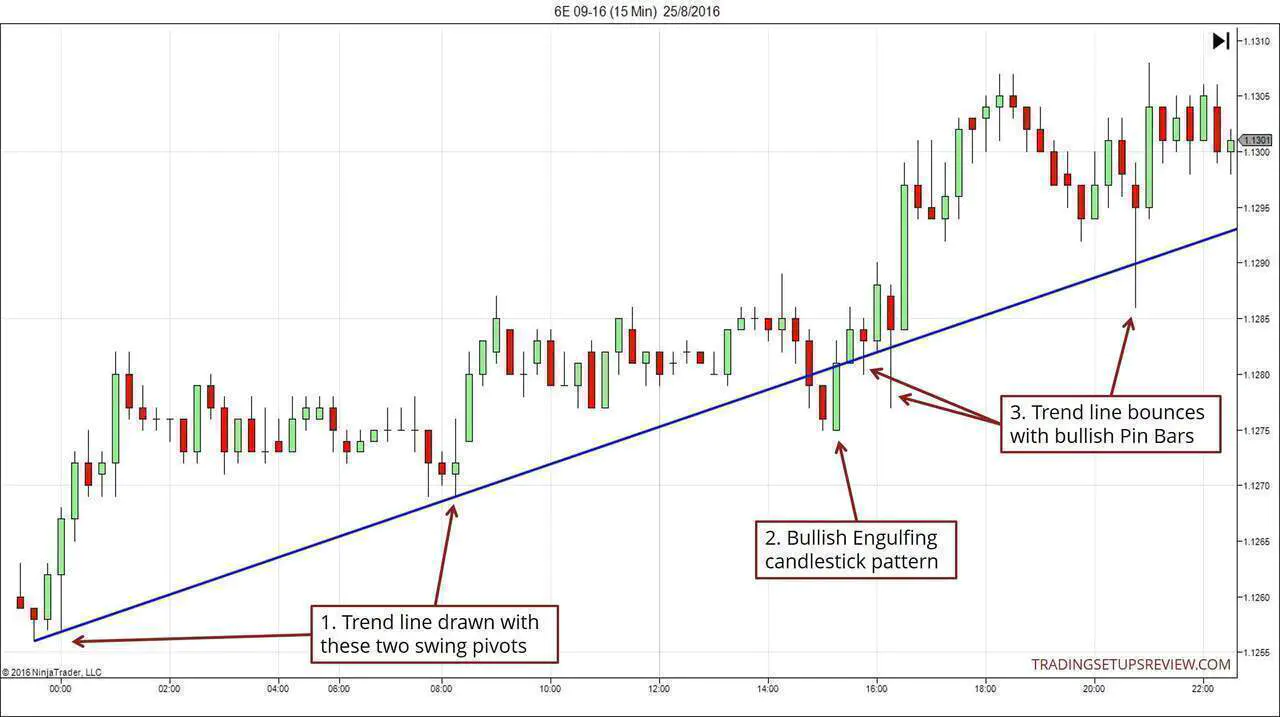
There are two main types of trendlines:
- Uptrend: Connecting gradually increasing lows, indicating an upward price trend.
- Downtrend: Connecting gradually decreasing highs, indicating a downward price trend.
How to draw a trendline:
A trendline is drawn by connecting at least two low points in an uptrend or two high points in a downtrend. However, a trendline is considered more reliable when there are more contact points (at least 3 points).
A trendline is not always a perfect straight line. Sometimes prices may break above or touch the trendline without fully breaking it.
2. Indicators MT4 - Horizontal line
The horizontal line in Forex trading is a basic but effective technical analysis tool that helps traders identify key support and resistance levels on the price chart. Support is the price level at which buying pressure is strong enough to prevent prices from falling further, while resistance is the price level at which selling pressure is strong enough to prevent prices from rising further.
Drawing horizontal lines on the chart makes it easier for traders to identify possible reversal points or continuation of trends, allowing for more accurate trading decisions. These support and resistance levels create areas where prices may have strong reactions, helping traders predict future price trends.

How to use horizontal lines:
- Trading at support level: When prices approach the support level and start to reverse, traders can look for buying opportunities.
- Trading at resistance level: When prices touch the resistance level and start to fall, this could be a selling opportunity.
3. Moving Average (MA)
The moving average (MA) is a popular technical indicator used to smooth price fluctuations and determine market trends. It is calculated by taking the average of closing prices over a certain N period. MA helps filter noise, highlights the main trend and can be used as support and resistance levels.
Although it reacts slowly to price changes due to past data, MA is very easy to use and suitable for both beginners and experienced investors.
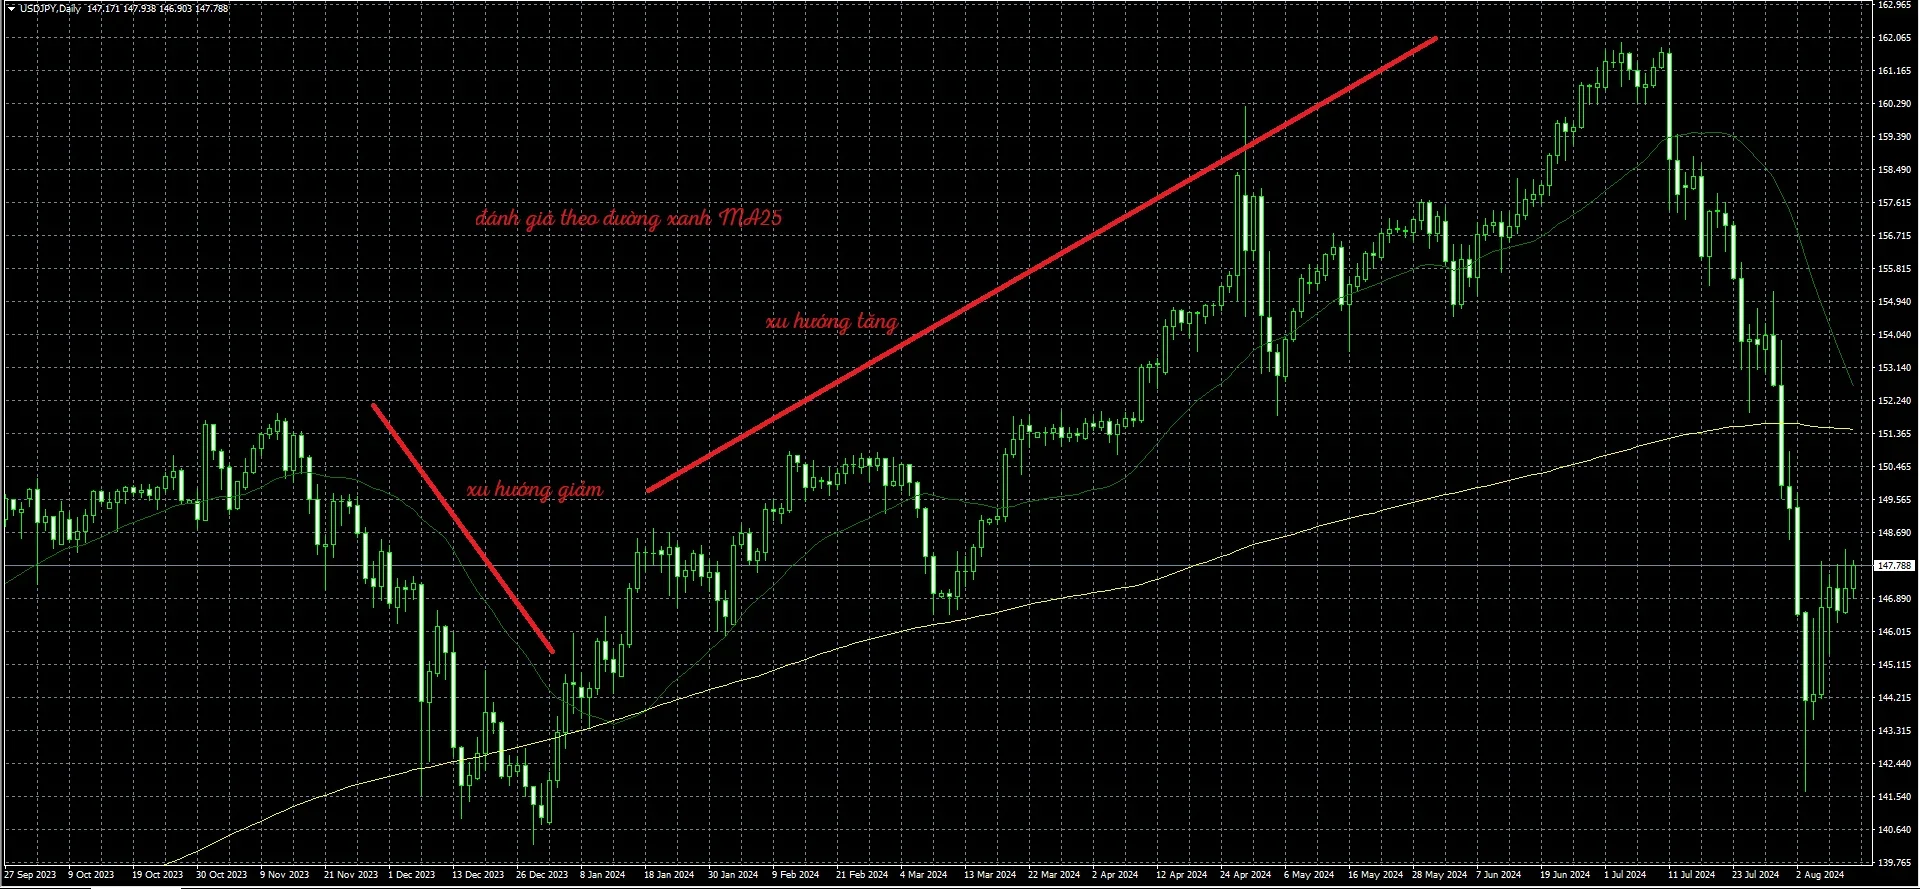
There are types of moving averages:
- Simple Moving Average (SMA)
- Exponential Moving Average (EMA)
- Weighted Moving Average (WMA)
4. Fibonacci
Fibonacci is a technical analysis tool based on the mathematical theory of Leonardo Fibonacci from the 12th century. The Fibonacci sequence starts from 0, 1, and each subsequent number is the sum of the two preceding ones (0, 1, 1, 2, 3, 5, 8,...). From this sequence, the golden ratio (approximately 1.618) and other ratios such as 23.6%, 38.2%, 61.8% are found, which help identify important price levels in asset price movements.
Fibonacci is often used to find entry points, take profits and cut losses in Forex and Crypto trading to better predict market fluctuations.
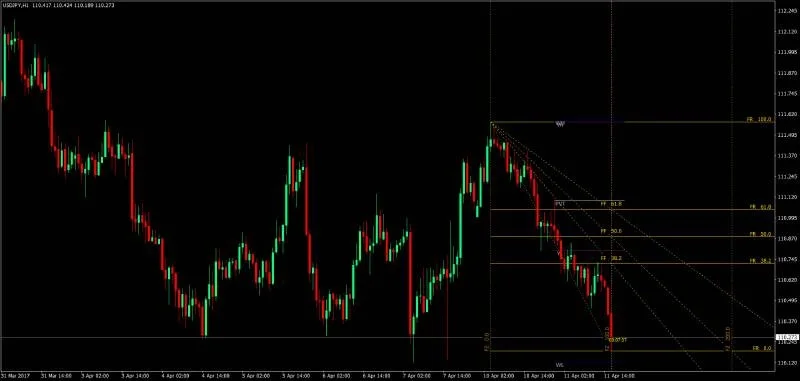
Fibonacci indicators include:
- Fibonacci Retracement
- Fibonacci Fans
- Fibonacci Arc
5. Bollinger Bands
Bollinger Bands is a popular technical analysis tool used to measure market volatility. This indicator consists of three bands based on a simple moving average (SMA):
- Middle Band: This is the SMA20, the 20-period simple moving average.
- Upper Band: Calculated by adding x times the SMA20's standard deviation.
- Lower Band: Calculated by subtracting x times the SMA20's standard deviation.
(x can be 1-2-3 times the standard deviation)
Using Bollinger Bands:
Bollinger Bands work effectively in markets that tend to move sideways (sideway). In this case, traders can apply the strategy of selling when prices touch the upper band and buying when prices touch the lower band. However, when the market has a clear trend, using this strategy may carry risks because prices could continue to move according to the current trend.
6. Stochastic indicator
The Stochastic indicator is a technical analysis tool that compares the closing price of a security to a price range over a specific period of time, in order to gauge price momentum. This indicator includes two main lines %K and %D, and is often used to identify momentum reversals of trends.

Using the Stochastic Indicator:
The Stochastic indicator has two main boundary levels, 20 and 80, to determine overbought and oversold conditions:
- When the indicator moves above the 80 boundary, this indicates the asset is in an overbought state. This is a warning signal that the uptrend may be ready to reverse soon.
- When the indicator falls below the 20 boundary, this indicates the asset is in an oversold state, and price may be ready to touch bottom and prepare for an uptrend.
The Stochastic indicator helps traders identify market conditions to make more accurate trading decisions.
7. MACD (Moving Average Convergence Divergence)
The MACD (Moving Average Convergence Divergence) indicator is a technical analysis tool developed by Gerald Appel in 1979. MACD is one of the most widely used and popular technical indicators used in stock market analysis, Forex and other asset types.
Structure of MACD:
MACD is calculated based on three key factors:
- MACD Line: Calculated by taking the EMA12 (12 period exponential moving average) minus the EMA26 (26 period exponential moving average). The MACD line represents the difference between these two moving averages.
- Signal Line: The EMA9 (9 period exponential moving average) of the MACD line. The signal line helps provide buy and sell signals.
- Histogram: The difference between the MACD line and signal line. The histogram displays changes in momentum of price and can change color to reflect market trends.
Using MACD:
- Buy Signal: When the MACD line crosses the signal line from below upwards and the histogram turns green, this indicates a potential buy entry.
- Sell Signal: When the MACD line crosses the signal line from above downwards and the histogram turns red, this indicates a potential sell entry.
To use the MACD indicator more effectively, it can be combined with other methods such as candlestick patterns, chart patterns, and price action.
8. RSI (Relative Strength Index) Indicator
The RSI indicator on MT4, abbreviated from Relative Strength Index, is also known as the relative strength index. It is used to measure the ratio of average price gains to losses over a specific period of time.
The RSI is displayed on a scale from 0 to 100.
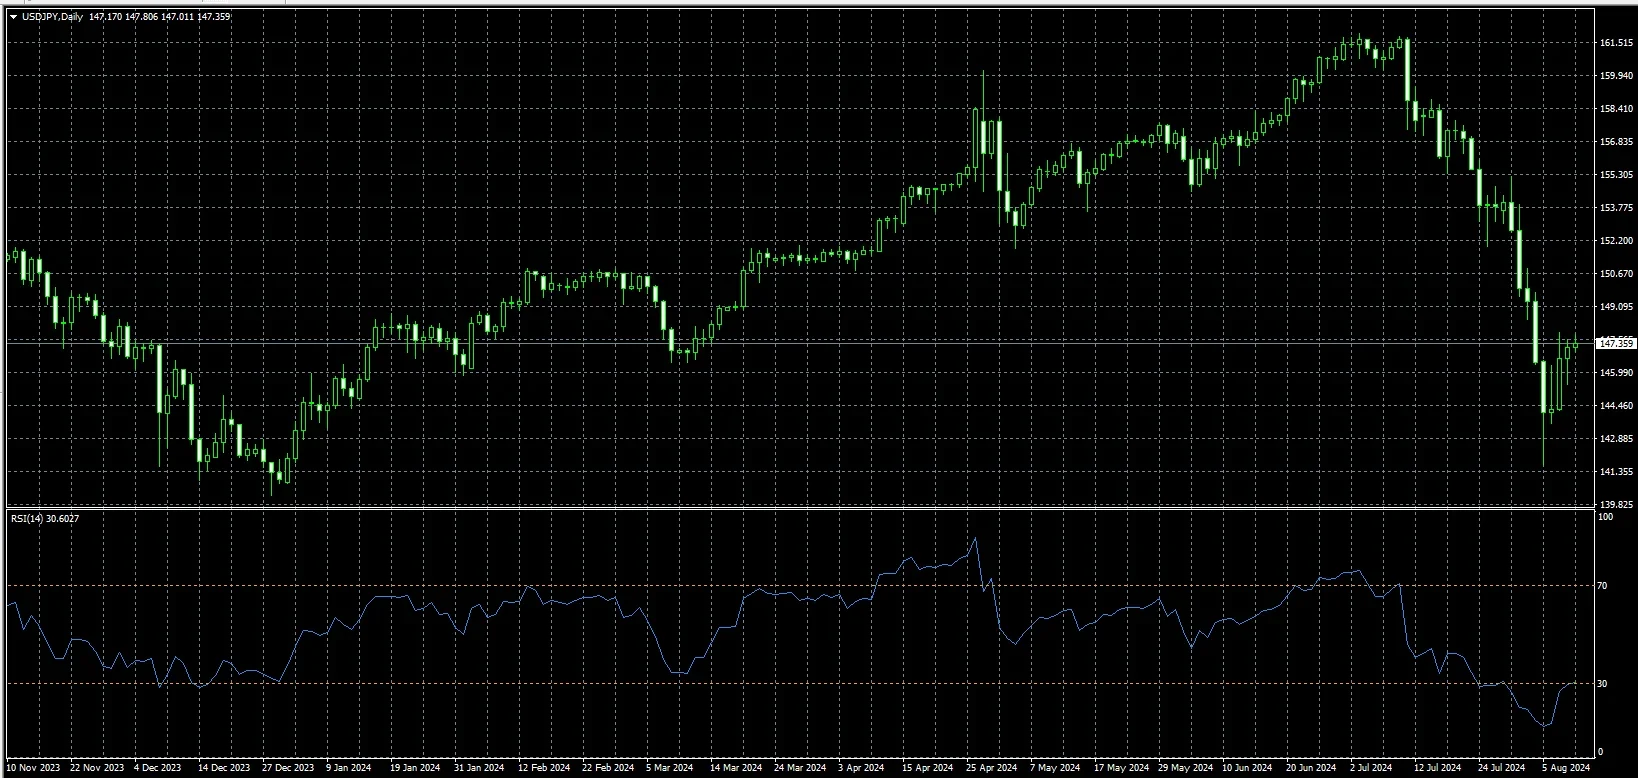
Using the RSI indicator:
- When the RSI moves above the 70 level, this indicates the asset may be overbought and the uptrend is likely to reverse.
- If the RSI is below 30, this indicates the asset may be oversold and price is ready to touch bottom and reverse.
- Between 30 and 70, the RSI is in a neutral zone. When the RSI fluctuates around the 50 level, the market has no clear trend.
9. Ichimoku Cloud Indicator
The Ichimoku Cloud (Ichimoku Kinko Hyo) indicator is a technical analysis tool developed by Satoru Hosoda in 1969. It is a powerful tool to identify support and resistance levels, gauge market momentum and provide trading signals.
The Ichimoku indicator is called a "cloud" because its shape resembles a cloud. This indicator uses moving averages to provide an all-in-one view of trends, support/resistance levels and entry/exit signals. The Ichimoku indicator set includes five key moving averages:
- Tenkan-sen (Conversion Line): Measures short-term trends.
- Kijun-sen (Base Line): Evaluates longer-term trends.
- Senkou Span A: Provides a dynamic support and resistance level.
- Senkou Span B: Also identifies dynamic support and resistance levels but is based on longer data.
- Chikou Span (Lagging Span): Compares current price to past price to identify trends.
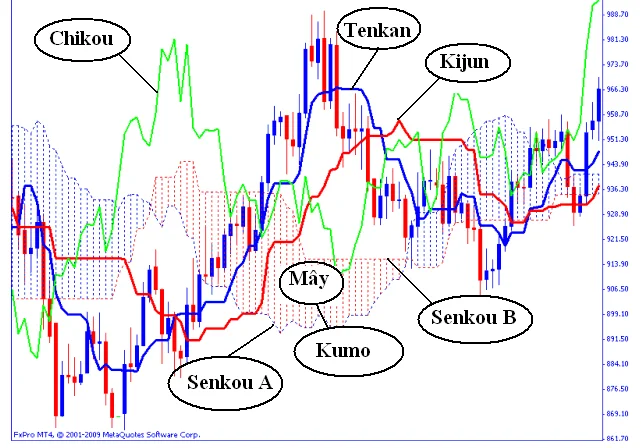
Using the Ichimoku Cloud:
- When the price trades above the Kumo cloud: The market is in an uptrend.
- When the price trades below the Kumo cloud: The market is in a downtrend.
- When the price is within the Kumo cloud: The trend is unclear.
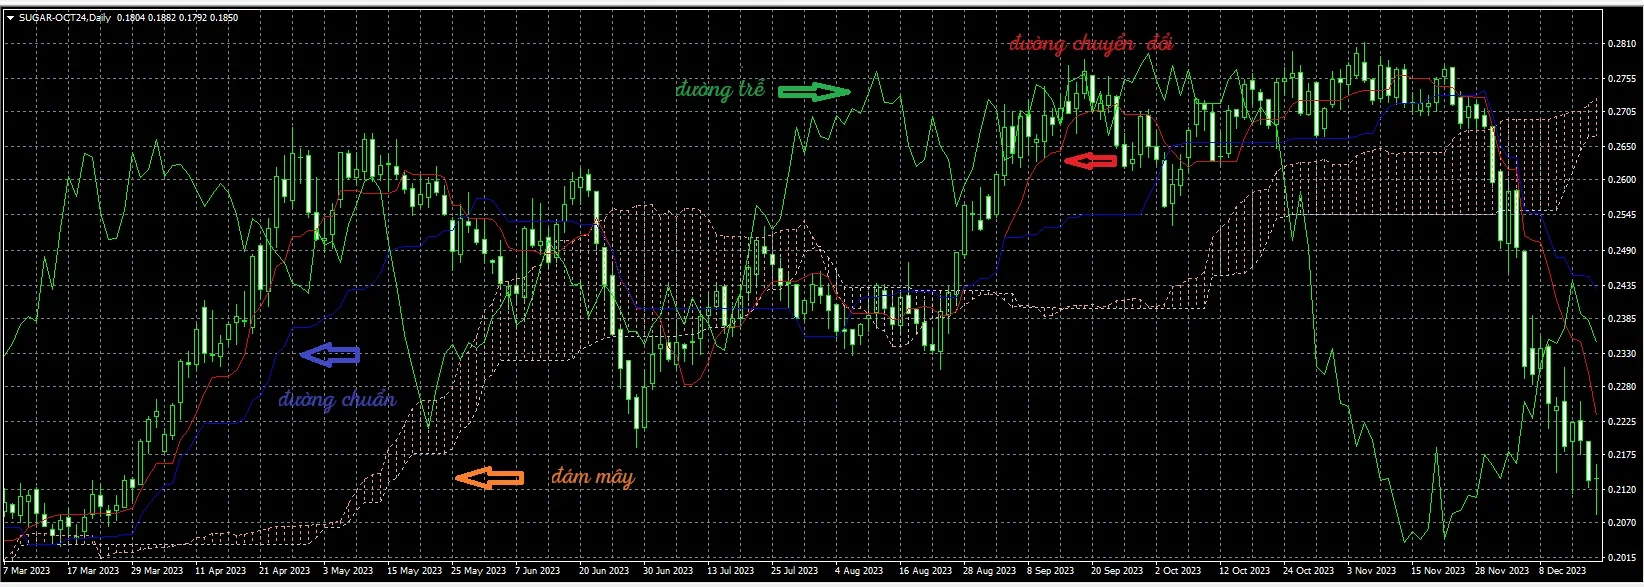
The thickness of the cloud also reflects the strength of market momentum. A thicker cloud indicates strong momentum, while a thinner cloud shows weaker momentum.
FAQ about Indicators MT4
1. Which indicator on MT4 has the highest profit potential?
The MACD (Moving Average Convergence Divergence) indicator is considered one of the most effective tools on the MT4 platform, helping traders achieve optimal profits regardless of strategy. MACD uses moving averages to provide easy trading opportunities following the main market trend.
2. Which indicators on MT4 are available for free?
On the MT4 platform, there are many free indicators that new traders can use. You can refer to indicators such as Zigzag, EMA 34 and 89 lines, RSI, automatic Fibonacci, and Accumulation Distribution.
You may also be interested in:
- Login to XM MT4 and Elevate Your Trading Experience
- Enhance Your Trading with XM VPS: Faster, Stable, Secure Access
Conclusion
Both leading and lagging indicators play an important role in technical analysis and Forex trading. The choice of indicator also depends on market conditions and individual trading strategies. Combining different types of indicators can provide a more comprehensive view of the market and lead to more effective trading decisions.
I hope the information provided by Smartlytrading is helpful for readers and helps you choose the most suitable Indicators MT4 based on your strategies. Best of luck!


.png.webp)
.png.webp)