Bollinger Bands MT4 Guide: Precision Strategies for Better Profits
In forex trading, the Bollinger Bands MT4 can help you identify market conditions such as being overbought or oversold, and predict future price volatility. If you are not yet familiar with applying this tool, please follow the article below. Smartlytrading will guide you on how to display the Bollinger Band on the MT4/MT5 platform for both computer and smartphone, as well as ways to make the most effective use of the Bollinger Band.
Guide to Displaying Bollinger Band on MT4
How to Display Bollinger Bands MT4/MT5 for PC
To add Bollinger Bands to the chart, follow these steps:
On the MT4 toolbar, click "Add" -> "Indicator Tools" -> "Trend" -> "Bollinger Bands" as guided below.
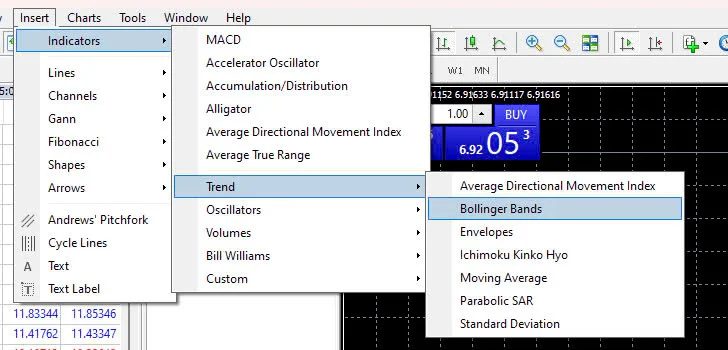
This will open a dialog box where you can adjust the "Period", "Deviations" and "Style" settings. After making changes, click OK.
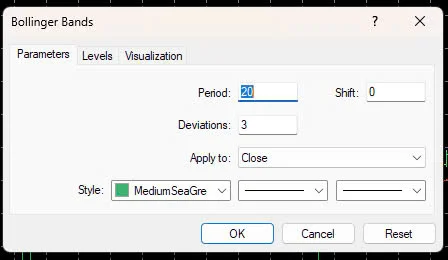
How to install Bollinger bands:
The Bollinger Band settings window will appear. Here you can change the parameters:
- Period: Choose values like 5, 7, 10, 14, 100 etc.
- Deviations: Choose values like 1, 2, 3 to display settings with 1σ, 2σ, and 3σ deviations.
- Style: Choose colors and line display style as preferred.
The basic method of using Bollinger Bands is to set 3 deviation levels: 1σ (1 deviation), 2σ (2 deviations), and 3σ (3 deviations).
Therefore, you should set the Bollinger band deviations from 1 to 3 to display the 1σ to 3σ Bollinger bands on the chart.
The period chosen for the Bollinger band should be similar to the period of the short-term moving average that you normally use. Referable values to set the period of the moving average can be found in articles related to using moving averages.
By setting the deviation position from 1 to 3, the 1σ to 3σ Bollinger bands can be displayed on the chart.
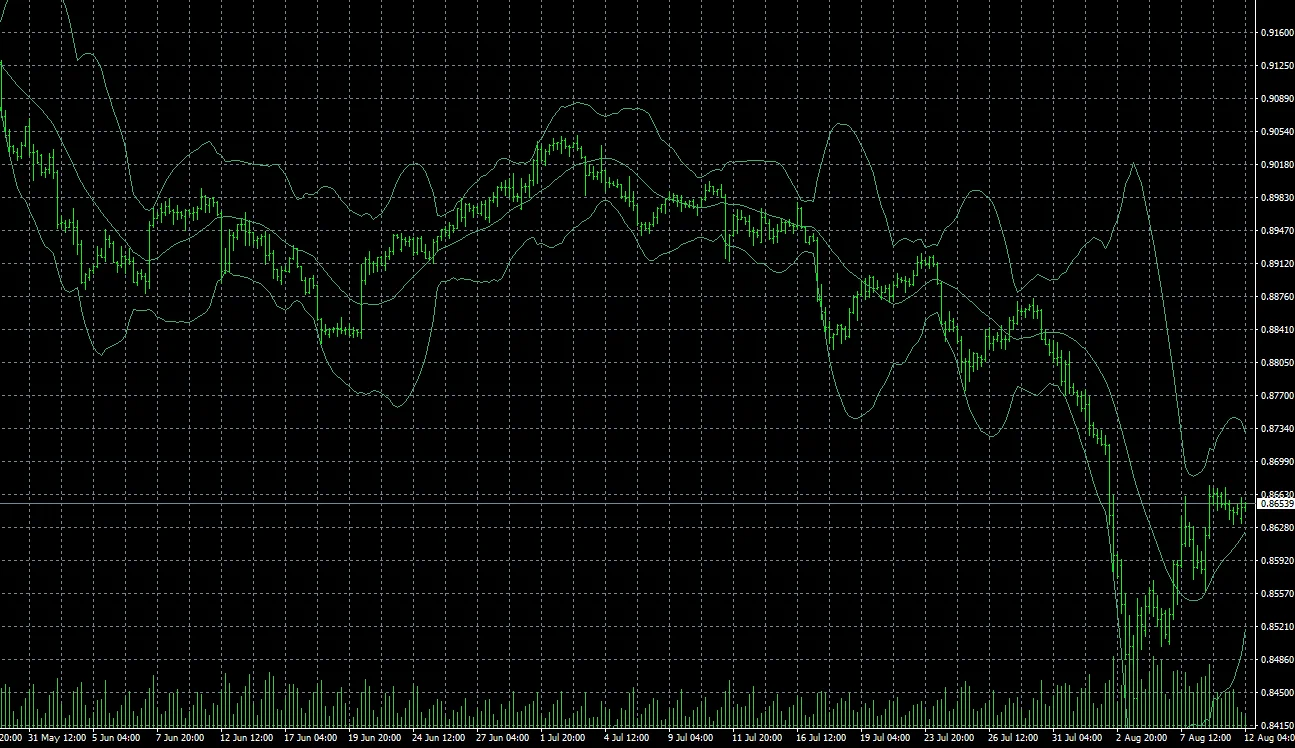
How to Delete Bollinger Bands:
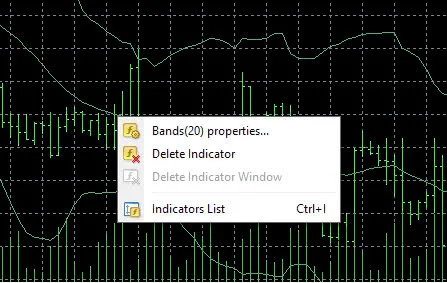
To remove Bollinger Bands, right click on the chart, select "Delete Indicator Tool" to remove the Bollinger Band display.
How to display Bollinger Bands MT4 for smartphones
To display Bollinger Bands on MT4/MT5 for smartphones, follow these steps:
- Open the chart screen on the "Chart Tab" of the MT4/MT5 app.
- Tap the "f" icon on the chart screen.
- Tap "Main Window" from the indicator screen.
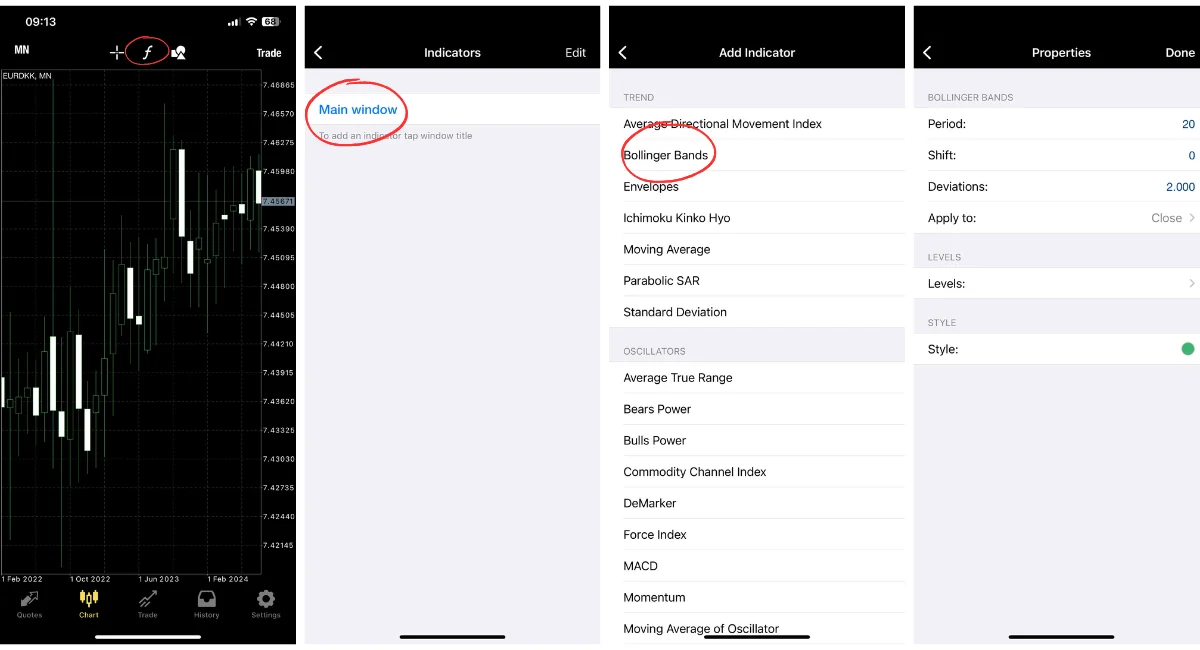
Tap "Bollinger Bands" on the "Add Indicator" screen, the setting screen will display. After making changes, tap the "Done" button.
To configure Bollinger Bands, tap "Bollinger Bands" in the "Add Indicator" screen.
The setting screen will display where you can change the "Period", "Deviations" and "Style" settings. After making changes, tap the "Done" button to complete.
Adjusting the Bollinger Band parameters helps customize the display to suit your trading strategy. The Bollinger Band period is typically set corresponding to the short-term moving average you use.
How are Bollinger Bands calculated?
Bollinger Bands are calculated automatically and displayed on the chart, rather than requiring you to perform manual calculations.
The Bollinger Band calculation is as follows:
σ = √(period × sum of squares of closing prices in period - sum of squares of closing prices in period) ÷ (period × (period-1))
- ±1σ Band: Moving average value ± standard deviation
- ±2σ Band: Moving average value ± 2 × standard deviation
- ±3σ Band: Moving average value ± 3 × standard deviation
So in summary, Bollinger Bands use a moving average as the middle band, and then place bands above and below it that are a set number (typically 1, 2 or 3) of standard deviations away from the moving average. The standard deviation is calculated based on the period using the formula provided. This calculation is done automatically by trading platforms rather than requiring manual calculation.
Guidelines for Trading Effectively Using Bollinger Bands
Below, I will share with you 4 main trading methods using Bollinger Bands MT4.
Counter-Trend Trading From Outside the Band
Method: Trade counter-trend when the price is outside the ±2σ (standard deviation) Bollinger Band with the assumption that the price will ultimately return to the band.
Principle: Statistically, the probability of the price being within ±1σ is 68.26%, ±2σ is 95.44%, and ±3σ is 99.73%. When the price exceeds the ±2σ band, this is a signal that the price has a tendency to return within this range.
=> This can be interpreted as: if the price is outside the +2σ band, you can place a sell order. Conversely, if the price is outside the -2σ band, you can place a buy order. Closing orders can be done at the middle line of the Bollinger Band.
This method is suitable for markets with some volatility, taking advantage of prices typically returning within the band.
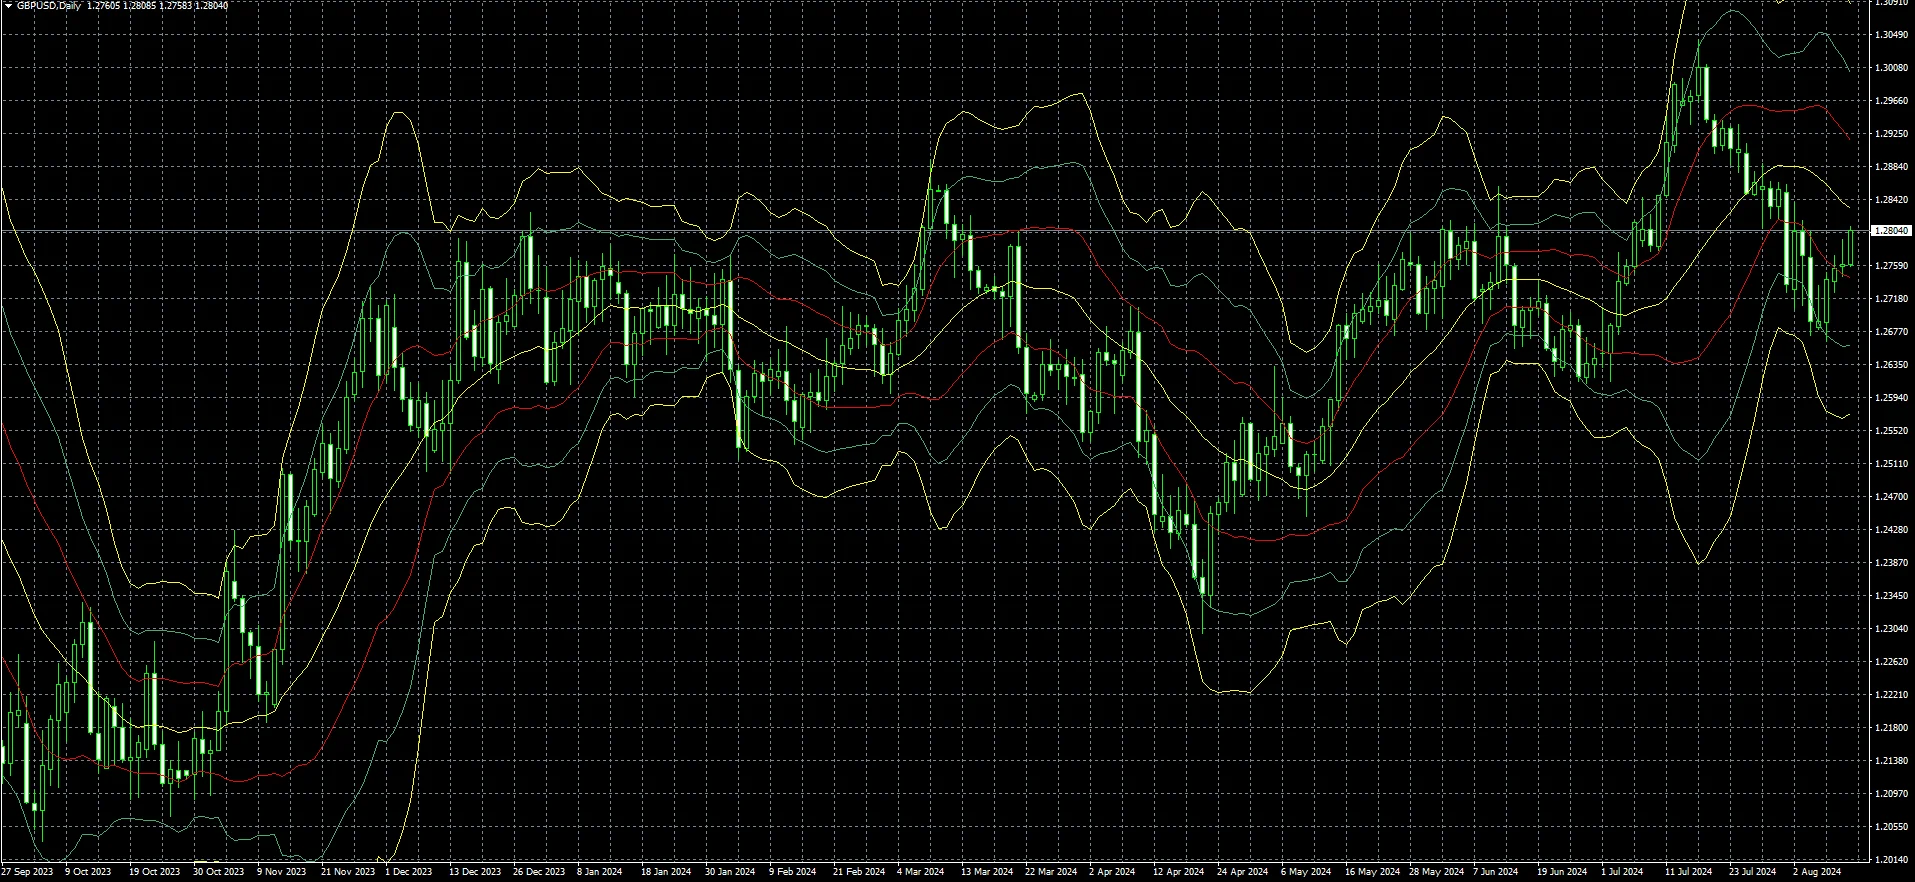
Based on the above image:
- ±1σ line: red line, probability of price being within ±1σ is 68.26%
- ±2σ line: blue line, probability of price being within ±2σ is 95.44%
- ±3σ line: outermost yellow line, probability of price being within ±3σ is 99.73%
- Middle line: middle yellow line
In other words, if the price is outside of these ranges, it can be considered an abnormal statistical value. Therefore, you can consider counter-trend trading with the forecast that the price will ultimately return within this range.
.png.webp)
According to the above trading example, you can place a sell order when the price passes the +2σ Bollinger Band and a buy order when the price passes the -2σ Bollinger Band. Orders can be closed at the middle line of the band.
The advice for you is that in a market with some price volatility, you can benefit by counter-trend trading when the price is outside the ±2σ band.
Trading Based on Squeeze (Narrowing)
A squeeze is when the width of the price volatility band narrows compared to past volatility. When this fluctuation is less than normal, it forms a Squeeze pattern.
In a Squeeze pattern, the price range is very narrow, so to profit, you should wait for the band to widen and trade in the direction during that period.
You can also close existing positions at this time.
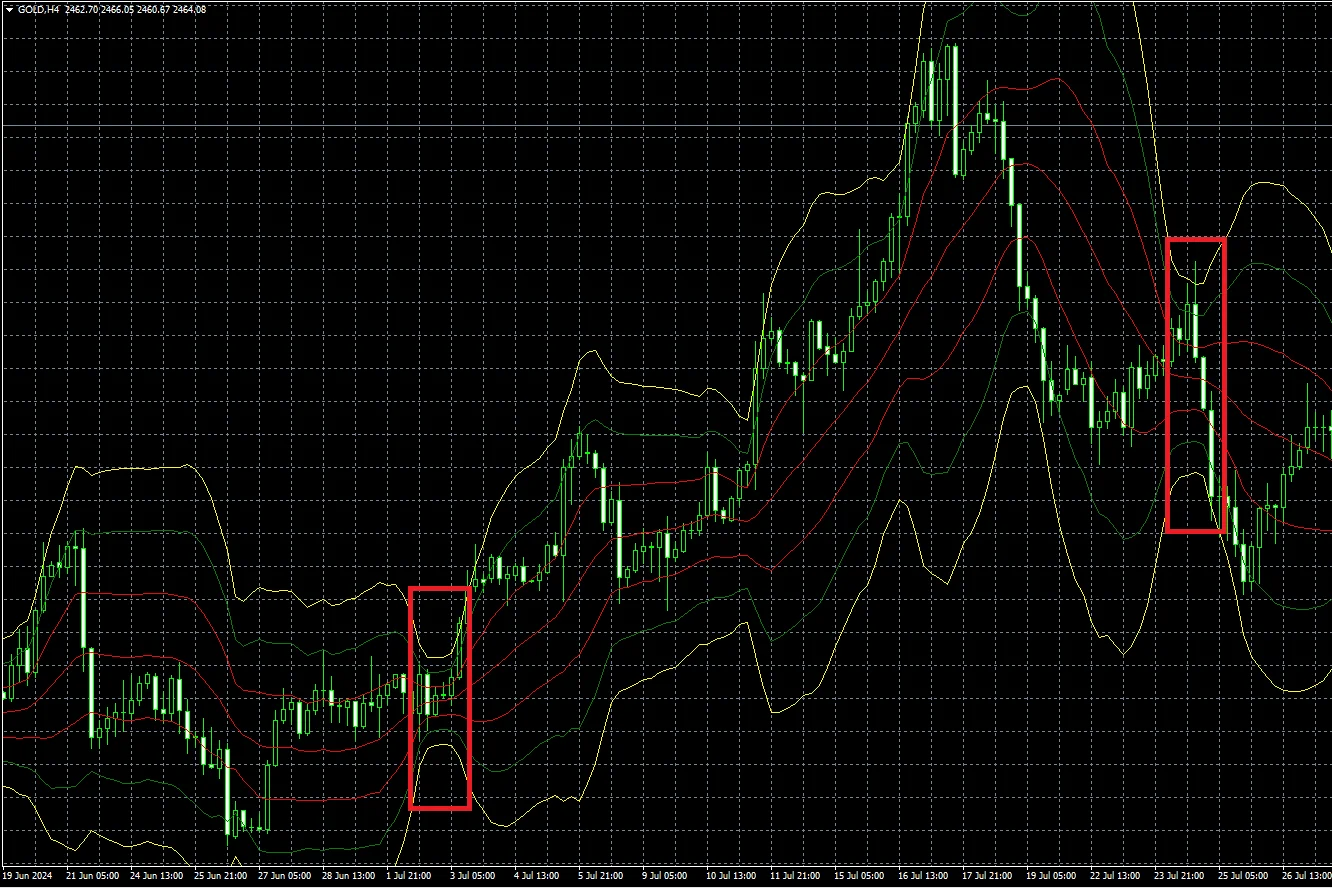
For example, in trading based on the Squeeze pattern:
You can place a new order when the price volatility band narrows, indicating a period of low volatility and consolidation.
Then, when the band widens again, expanding the volatility range, you trade in the direction of the expansion to optimize profits.
.png.webp)
The advice is to profit by entering trades in the direction of the widening movement as the band expands once more. This allows you to catch the breakout from the squeeze pattern and ride the increased volatility and potential trending move.
Trading Based on Expansion (Widening)
Expansion occurs when the upper and lower limits of the volatility band increase. When the probability of greater fluctuation is higher than in the past, it forms an Expansion pattern.
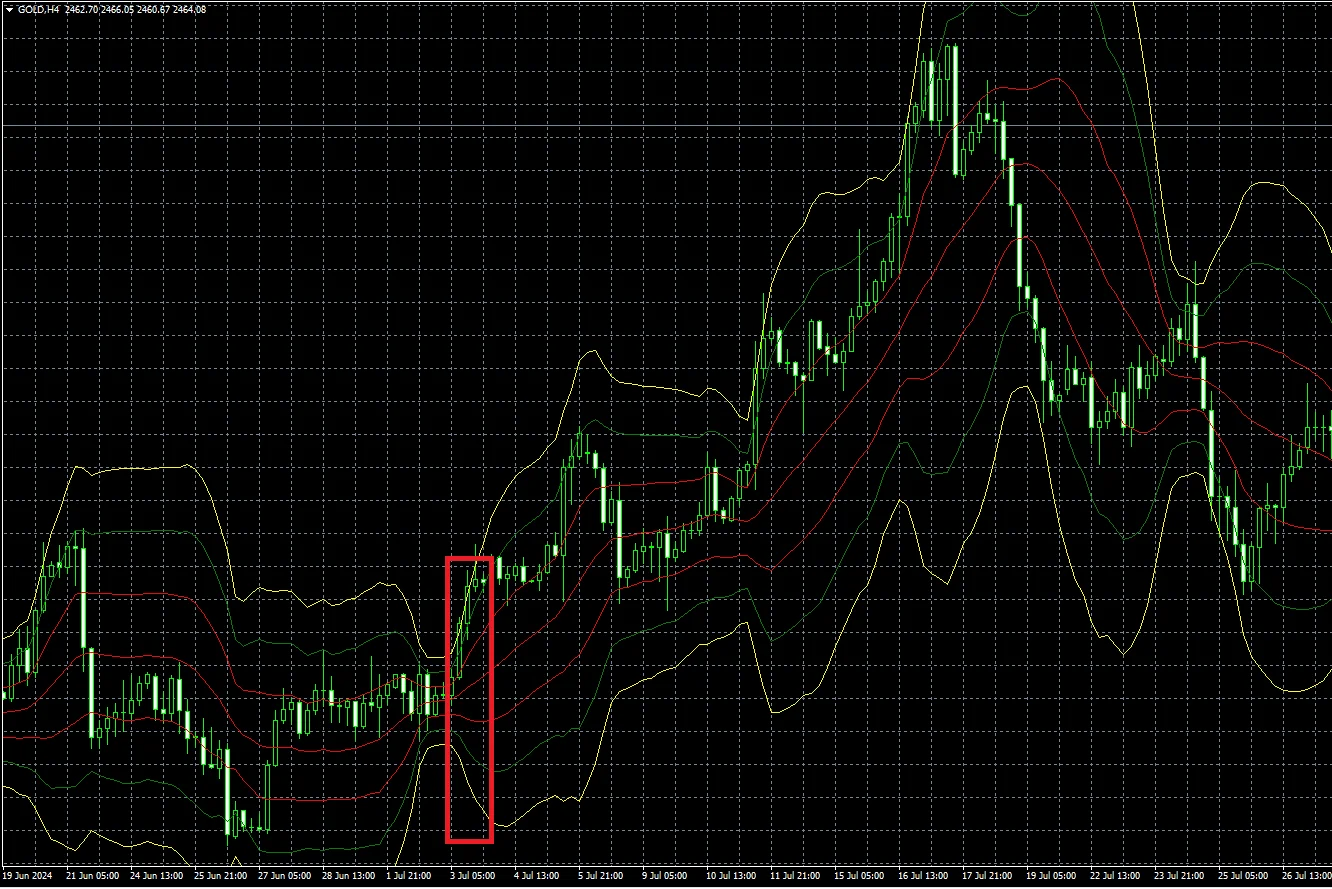
In an Expansion pattern, prices fluctuate strongly, making it easier to profit by trading with the direction as the band widens. Counter-trend trading may carry higher risks.
.png.webp)
You can place buy orders as the band widens in direction. The advice is to optimize profits by trading with the direction of widening band movement as it transitions from a squeezing state.
Walking The Bands
Walking The Bands is a price pattern where fluctuation occurs between ±1σ and ±2σ while creating a distinct trend. The name comes from the pattern resembling "walking" along the volatility bands.
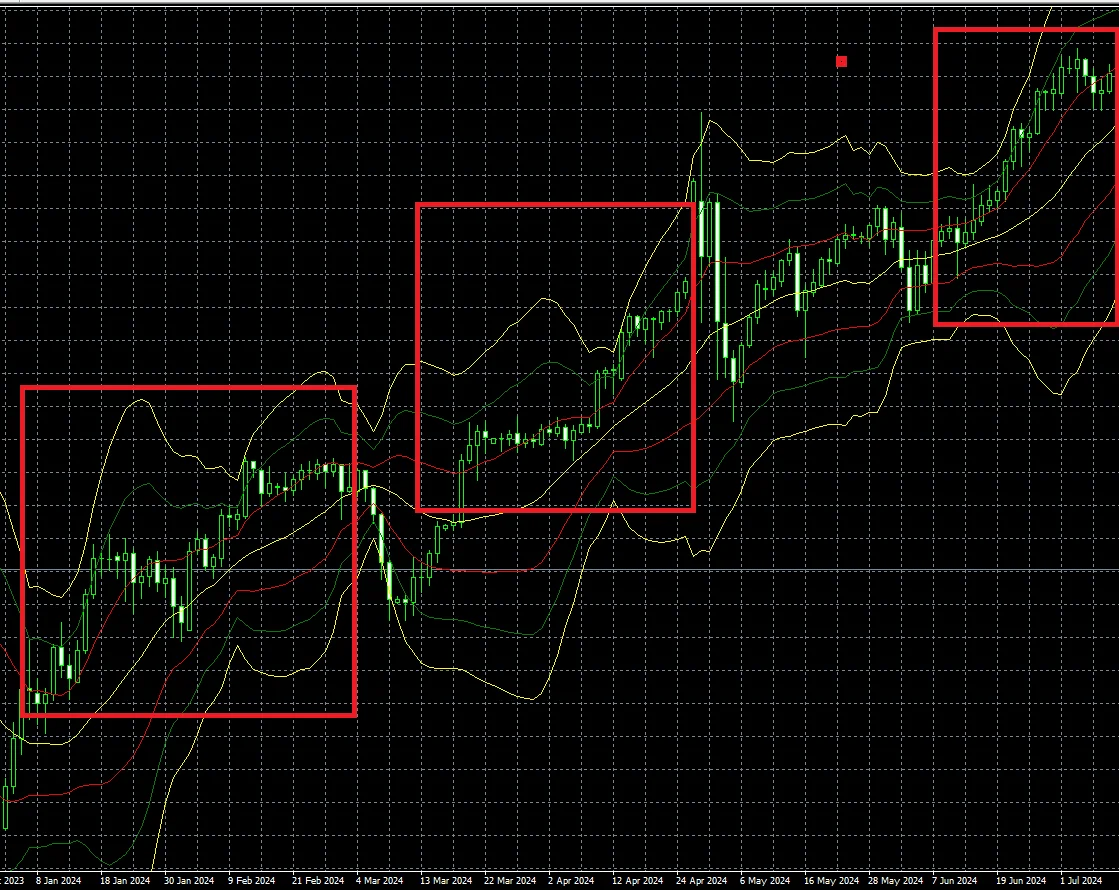
When this pattern is in an uptrend or downtrend, you can profit by trading in the direction, placing orders at ±1σ and closing at nearing ±2σ.
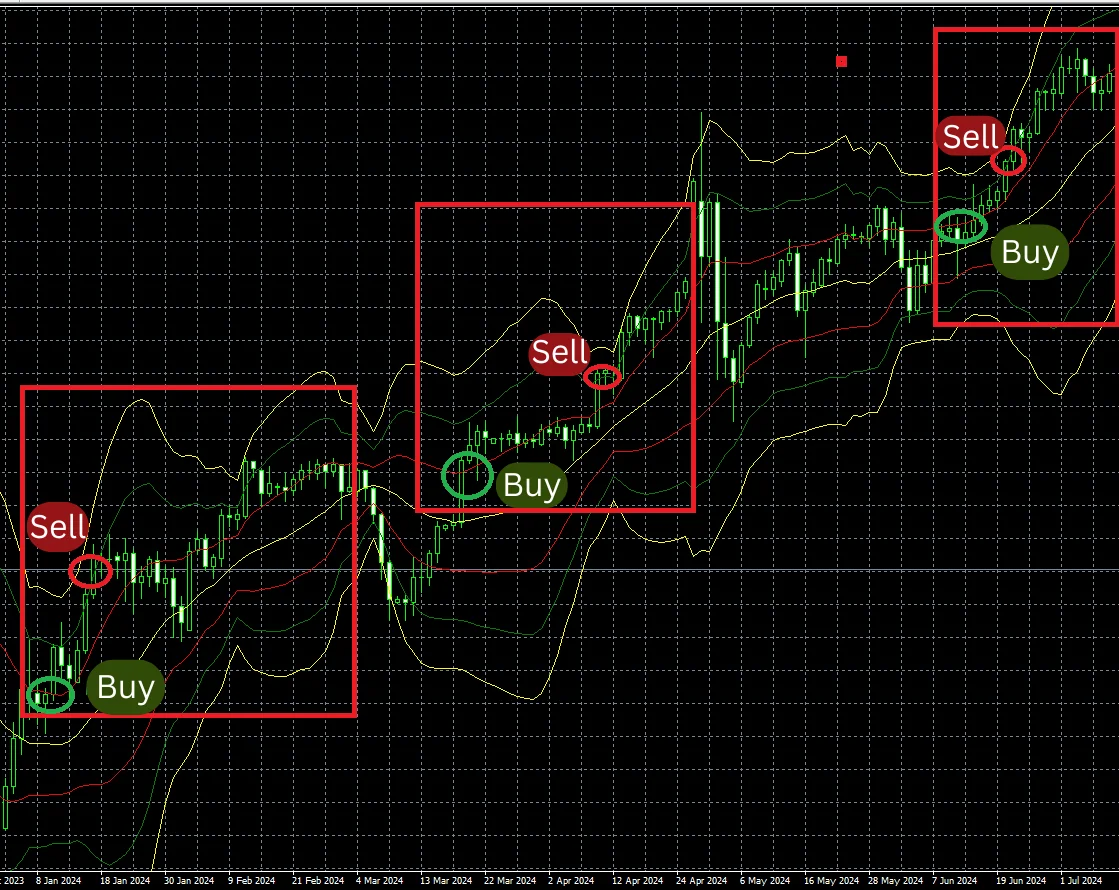
For example, place a buy order at +1σ and close as the price nears +2σ. The advice is to optimize profits by trading the trend from +1σ to +2σ (or -1σ to -2σ).
You may also be interested in:
- How to Use Horizontal Line MT4 for Accurate Market Analysis
- Moving Average MT4 - A Key Tool for Smarter Trading
Conclusion
The inventor of Bollinger Bands designed this tool primarily to support trend-following trading strategies, rather than counter-trend strategies. For this reason, recommended methods when using Bollinger Bands include trading when the bands have a tendency to squeeze, expand, and walk.
Each method has its own advantages and risks, so selection and application should consider market conditions and your individual strategy.
I hope the information provided by Smartlytrading above helps you understand and apply Bollinger Bands MT4 better! Wish you success in your trading.


.png.webp)
.png.webp)