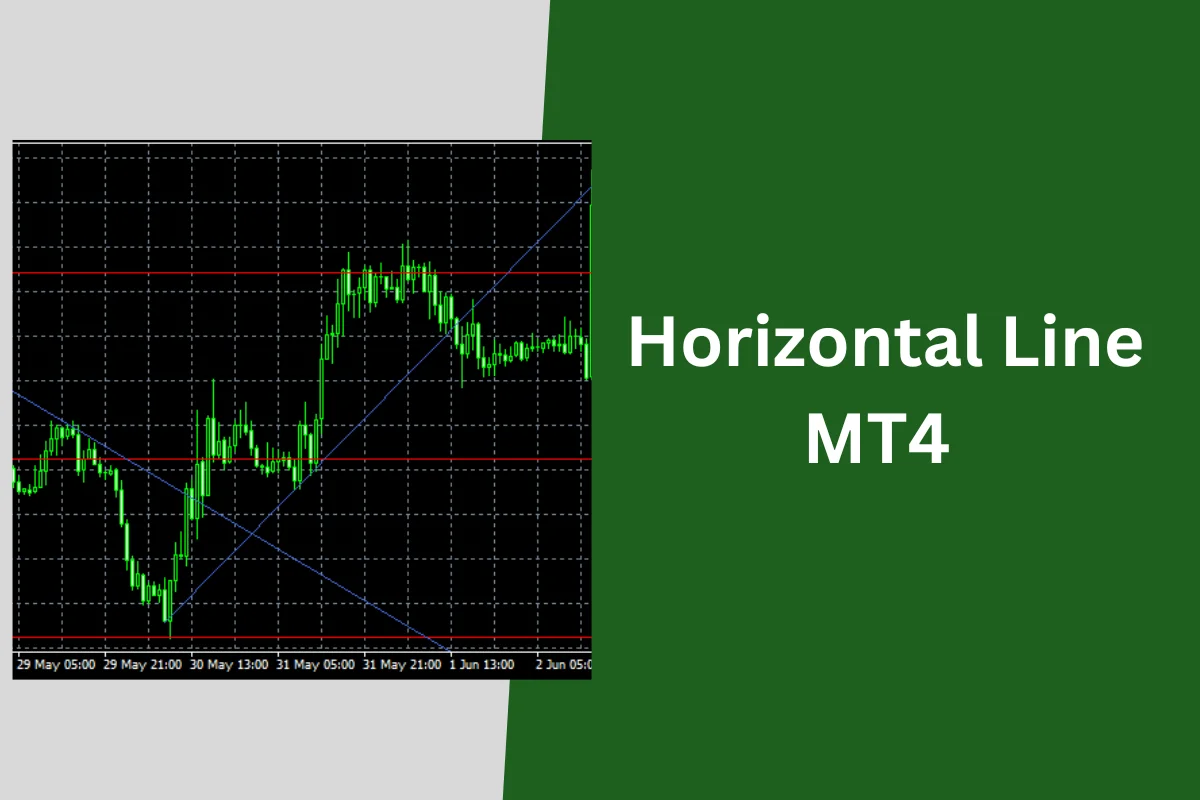
How to Use Horizontal Line MT4 for Accurate Market Analysis
Using Horizontal Line MT4 chart is a basic technical analysis technique that helps traders identify support and resistance levels on the price chart. Mastering the skill of drawing horizontal lines will greatly benefit traders. In this article, Citinews will help you better understand how to draw horizontal lines in forex trading!
1. Concept of Horizontal Line
A horizontal line is a straight line drawn on the price chart, passing through points where prices have previously decreased or increased. This line can act as a support level (where prices tend to stop declining and may start increasing) or resistance level (where prices tend to stop rising and may start declining).
Why Do We Need To Draw Horizontal Lines?
When you look at a price chart without any indicators, prices seem to move randomly without a clear trend. However, when drawing horizontal lines, you can easily identify important price levels, which allows you to make trading decisions more accurately. Horizontal lines help you see areas where prices are likely to reverse direction or continue the trend more clearly.
Guide to drawing horizontal lines on MT4/MT5 charts
How to draw horizontal lines on a computer (PC):
Open the chart you want to add a horizontal line to. On the MT4/MT5 tool bar, select the horizontal line icon "─".
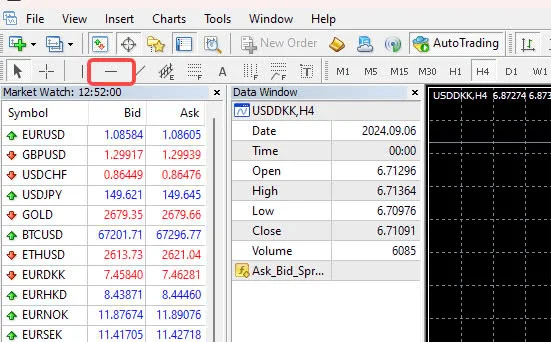
Hold down the left mouse button and drag the horizontal line to the desired position on the chart, the horizontal line will appear.
How to draw Horizontal Line MT4 /MT5 on a smartphone:
- Open the MT4/MT5 app and select the chart you want to edit.
- Tap the graphics icon "◯△□" on the screen.
- In the add object menu, select the horizontal line icon "─".
- Press and hold on the chart screen to place the horizontal line at the desired position.
- You have successfully added the horizontal line.
How to delete a horizontal line that has been added to the MT4 chart?
To delete a horizontal line that has been added to the MT4 chart, you can follow these steps:
Double click on the horizontal line on the chart. Small white dots will appear around that horizontal line. Press the "delete" button to delete.
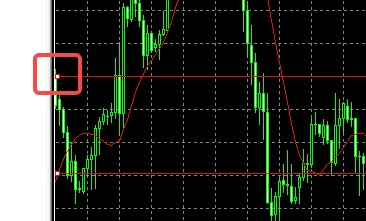
Horizontal line drawing point
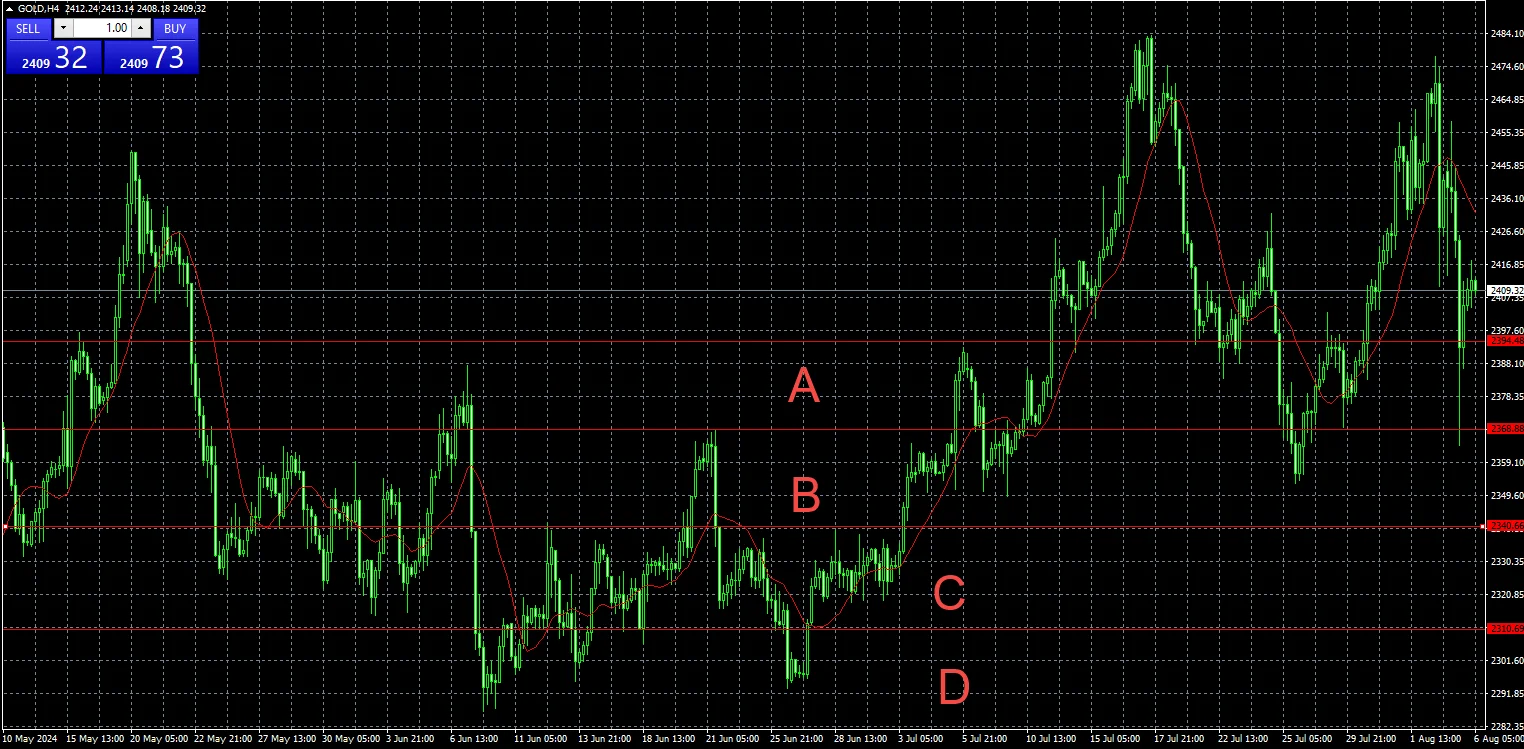
When the chart is displayed on the timeframe commonly used for trading, it connects past price fluctuation points with horizontal lines.
When you draw multiple horizontal lines, they often have a relatively uniform width. For example, points A/B/C/D in the chart below all have a similar width.
When horizontal lines are drawn at almost equal intervals, this indicates a high likelihood of price fluctuation at the horizontal lines in the future.
Guide to forecasting trading with horizontal lines
Predicting trades when price touches the horizontal line
When the price touches a horizontal line, you can predict as follows:
- If the horizontal line is above the price, it acts as a resistance line. When the price touches the resistance line, you can consider selling at the contact point.
- If the horizontal line is below the price, it acts as a support line. When the price touches the support line, you can consider buying at the contact point.
The horizontal lines on the chart often act as resistance or support levels, making it easier for you to decide to buy or sell.
For example, in the chart below, you should buy when the price increases at the horizontal line and sell when the price decreases at the horizontal line.
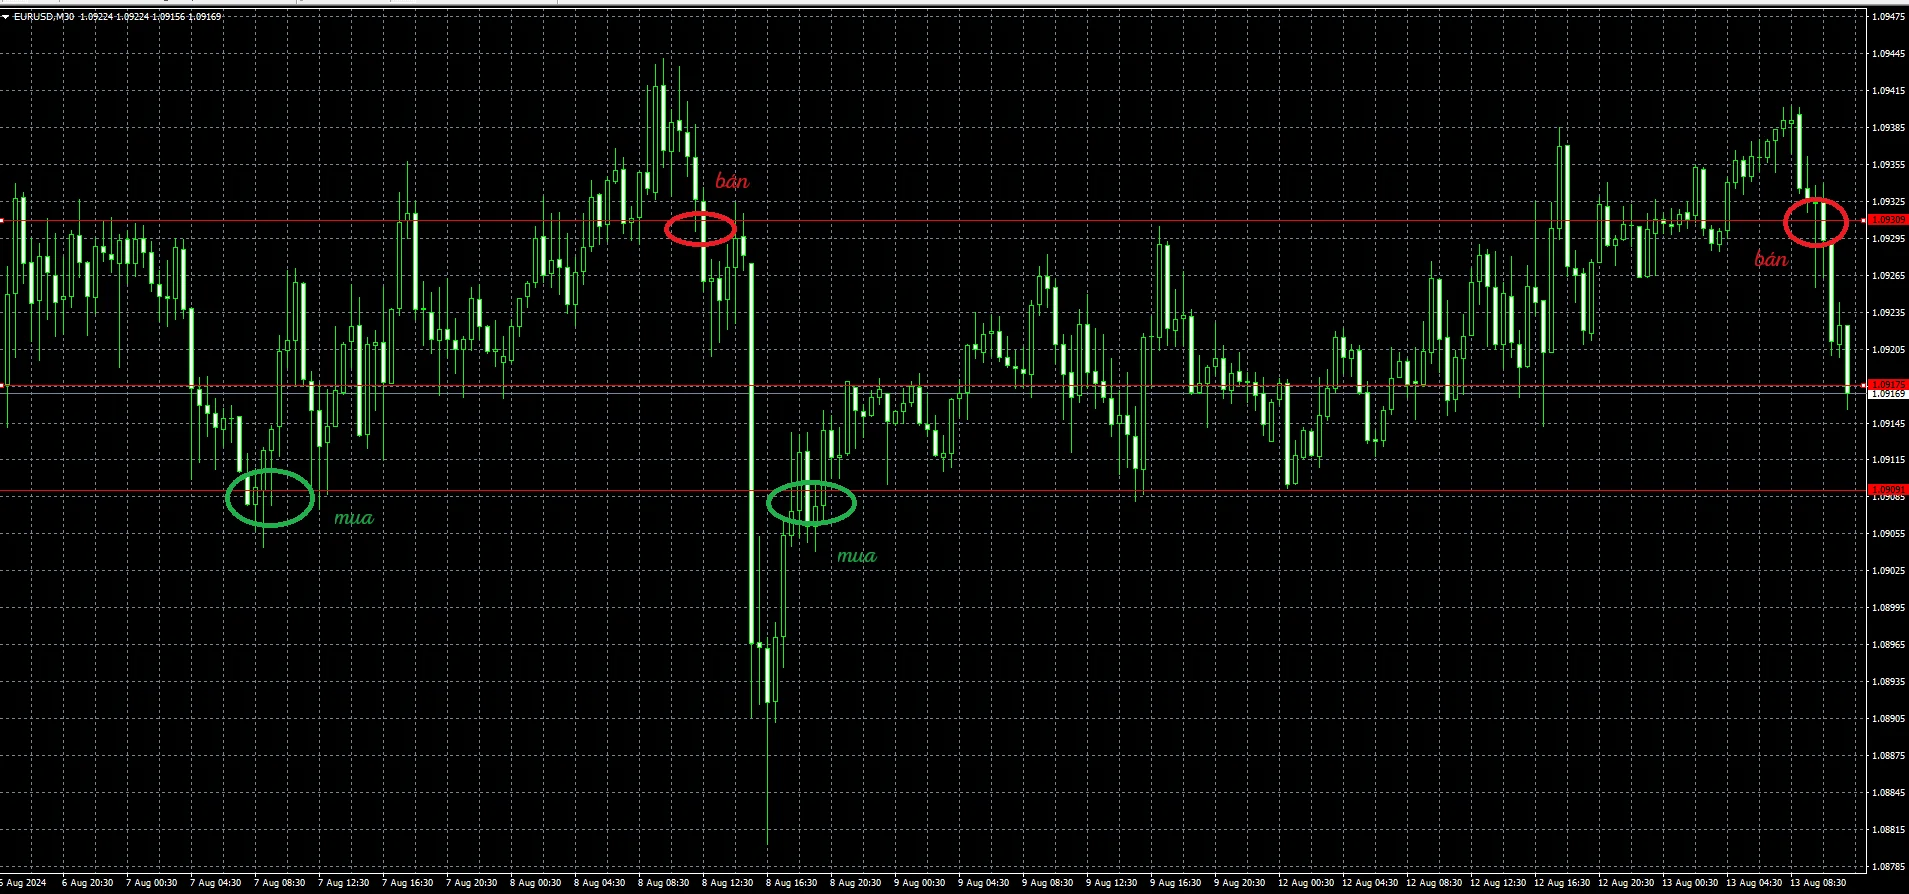
- When the horizontal line is above the price, it is considered a resistance line. When the price touches the resistance line, there is a tendency to decrease. You can easily earn a profit by placing a "sell" order when the price decreases at the contact point with the resistance line.
- When the horizontal line is below the price, it is considered a support line. When the price touches the support line, there is a tendency to increase. You can easily earn a profit by placing a "buy" order when the price increases at the contact point with the support line.
Trading when price breaks the horizontal line
When the price breaks through the horizontal line, the actions can be:
- If the price rises above the resistance line, you can place a buy order.
- If the price drops below the support line, you can place a sell order.
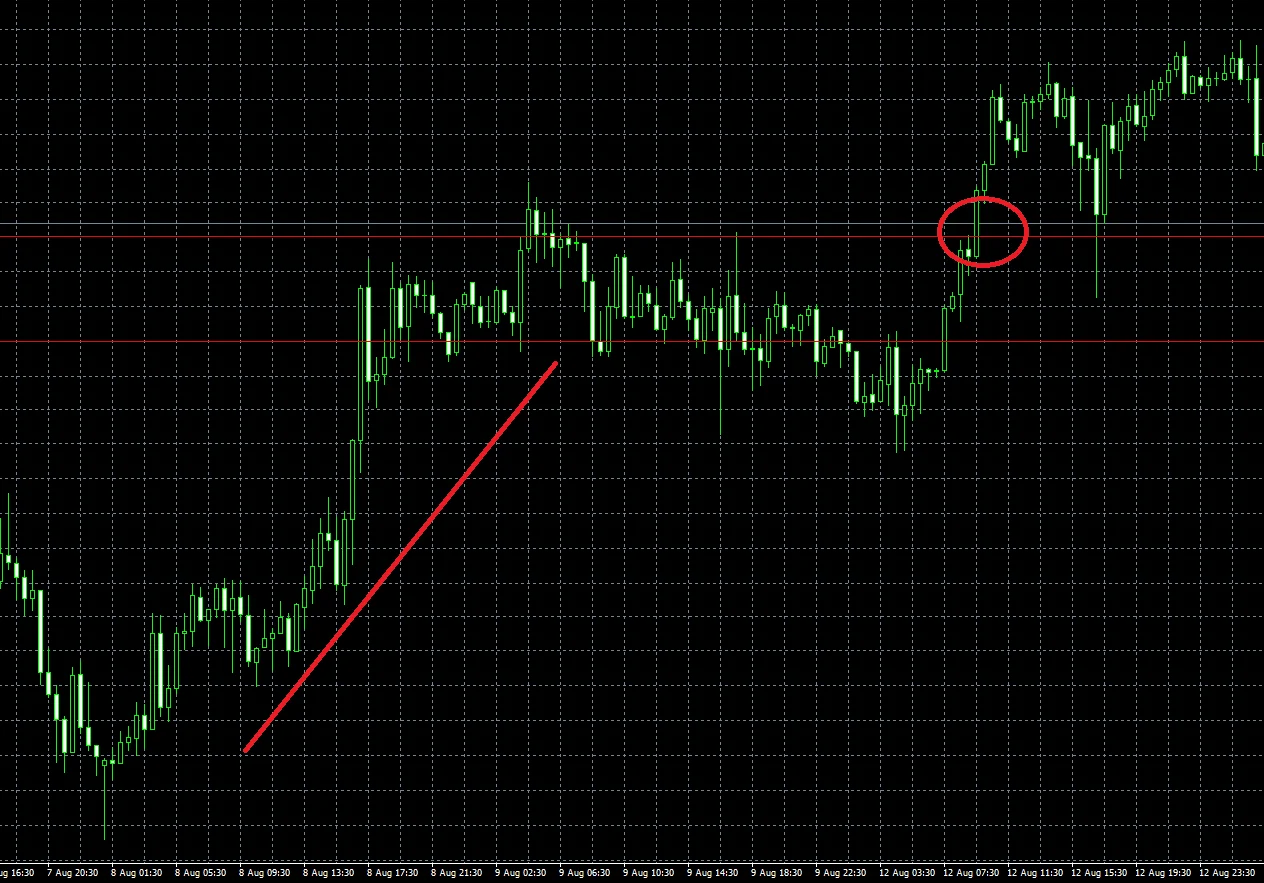
The horizontal lines will become resistance and support levels, so when the price breaks through these levels, the price trend is likely to continue in the direction it just broke through.
The chart below shows the price increasing and breaking through the resistance line and continuing to increase. If you place a "buy" order at the point where the price breaks through the resistance line (circled in orange), you will have an opportunity to profit.
Horizontal Line MT4 drawing method depends on individual
Horizontal lines are approximate standards
The method of drawing horizontal lines can vary depending on each user. Horizontal lines are generally considered a relative standard. To draw horizontal lines, you can connect the past high and low price levels of candles with straight lines and display them on the chart.
However, the drawing method can vary depending on whether it includes shadows (high/low prices) or not.
Specifically, the position of the horizontal line can change depending on the position of past prices. For example:
- Orange line: Includes shadows (high/low prices)
- Red line: Does not include shadows (high/low prices)
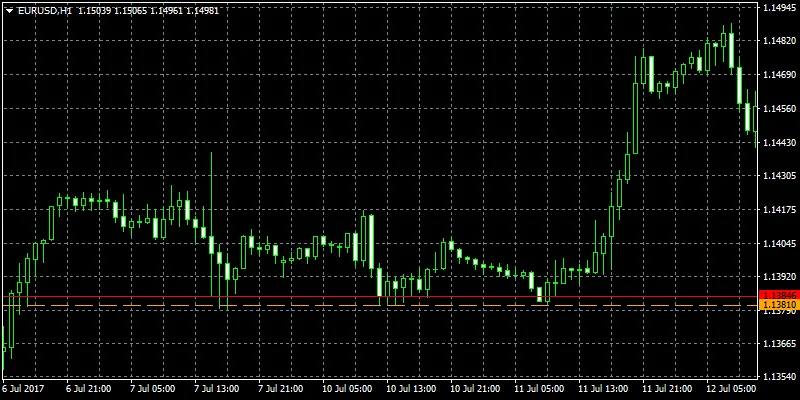
In the chart, the red horizontal line does not include shadows, while the orange horizontal line includes shadows. This can lead to differences in the position of horizontal lines on the chart.
In addition, horizontal lines can be aligned with different candles. For example, it can be aligned with the candle where the price declined stopped for the second time as a support level. However, the position will change if the horizontal line is aligned with the third declining candle.
Importantly, horizontal lines are not always perfect for rising or falling trends. Therefore, they should be used as a relative standard.
Notes when using Horizontal Line MT4
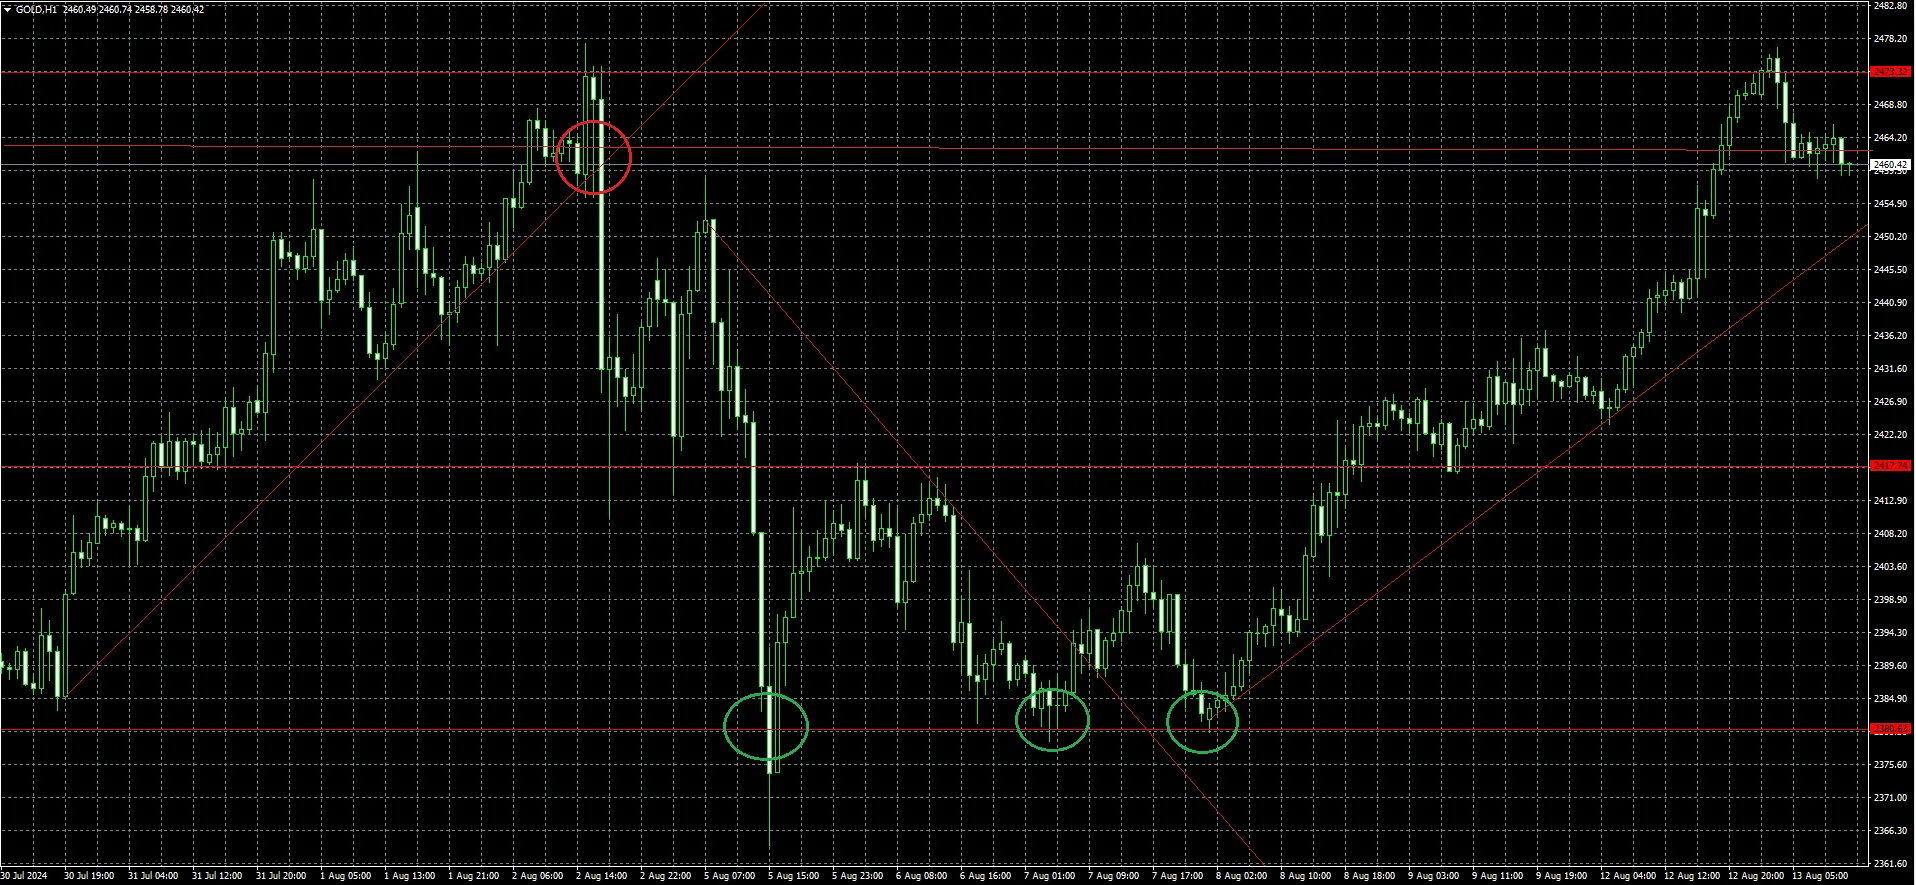
One point to note is the phenomenon of "deceptive fluctuation", when market prices seem like they will reverse direction but actually do not. When prices break support lines such as horizontal lines or trend lines, many traders may think the market has reversed and execute loss-cutting orders. However, prices can return to the original movement.
On the market, there are strong and weak traders, and large investors such as hedge funds can use tactics to create fake fluctuations, deceiving weaker traders. Be careful of these fluctuations and do not be deceived when trading with MT4 horizontal lines or trend lines.
You may also be interested in:
- MT4 vs MT5: Key Differences to Boost Your Trading Efficiency
- Remove XM MT4 Safely: Quick and Easy Removal Process
Horizontal lines are an important technical analysis tool in financial trading. Mastering different ways to draw horizontal lines helps provide context and orientation for traders' decisions, while improving analytical and trading planning capabilities.
I hope the information provided by Citinews has helped readers apply the Horizontal Line MT4 drawing method proficiently! Wish you success in your trading.


.png.webp)
.png.webp)