.png.webp)
How to Use Ichimoku Kinko Hyo MT4 for Precise Trading
Ichimoku Kinko Hyo MT4 is one of the powerful and popular technical analysis tools on the MT4 trading platform. This article will guide you on how to use Ichimoku Cloud to capture trends and identify effective entry points.
What is Ichimoku Kinko Hyo MT4?
Ichimoku Kinko Hyo (IKH) is a comprehensive technical indicator widely used in financial market analysis. It provides an overview of trends, support and resistance levels, as well as potential trading signals. When combined with the MT4 trading platform, IKH becomes a powerful tool for traders.
Why should IKH be used on MT4?
- Comprehensive: IKH provides more market information than single indicators.
- Flexible: Can be applied to various timeframes and different markets.
- User-friendly: MT4 provides tools and features that make IKH easy to customize and use.
- Clear signals: IKH provides clear trading signals to help make better buy and sell decisions.
How to use Ichimoku Kinko Hyo MT4 on PC
To use Ichimoku Kinko Hyo MT4, you need to install it on the trading chart. Here are the specific steps:
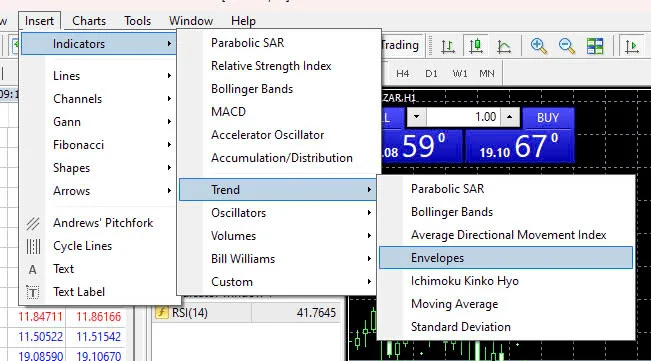
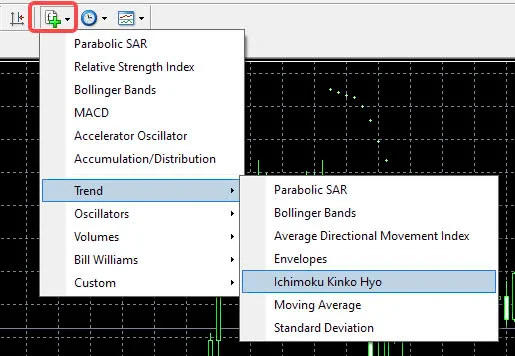
Step 1: Find the tool's function. You can apply one of the following three methods:
- Method 1: From the tool bar, click Add -> Support Tools -> Trend -> Ichimoku Kinko Hyo.
- Method 2: From the icon bar, click the + icon -> Trend -> Ichimoku Kinko Hyo
- Method 3: From the Side Panel next to the chart, click on Ichimoku Kinko Hyo
Step 2: The setting window pops up, keep the default setting parameters to use, just click OK. You can change the color of the lines in the Color tab (not required)
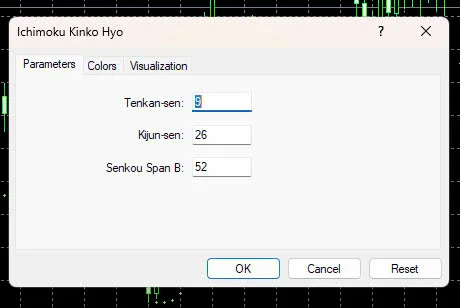
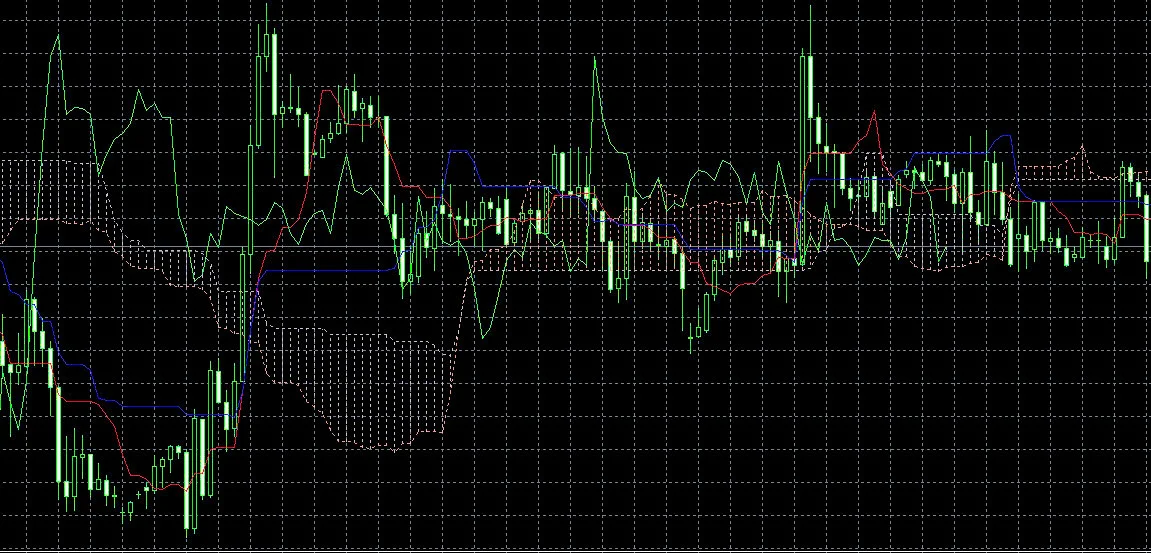
Step 3: Complete. After setting up, Ichimoku Kinko Hyo MT4 will be applied to the trading chart as shown below.
How to remove Ichimoku Kinko Hyo MT4
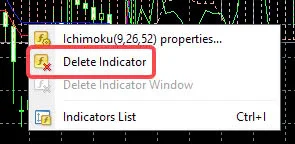
In case you no longer want to use this supporting indicator, you can remove it with the following steps:
- Step 1: Right click on the trading chart -> Support Tools
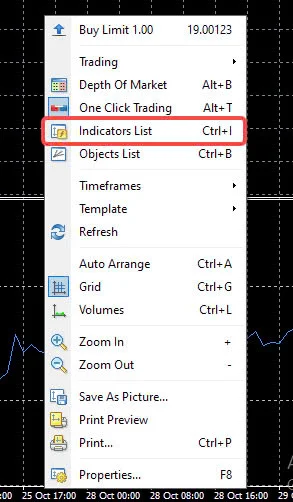
- Step 2: Click on Main Chart -> Ichimoku Kinko Hyo -> remove.
How to read Ichimoku Kinko Hyo MT4
To understand and effectively use IKH, you need to grasp how to read its components. IKH is constructed from 4 main components including: lagging span, conversion line, base line, and cloud.
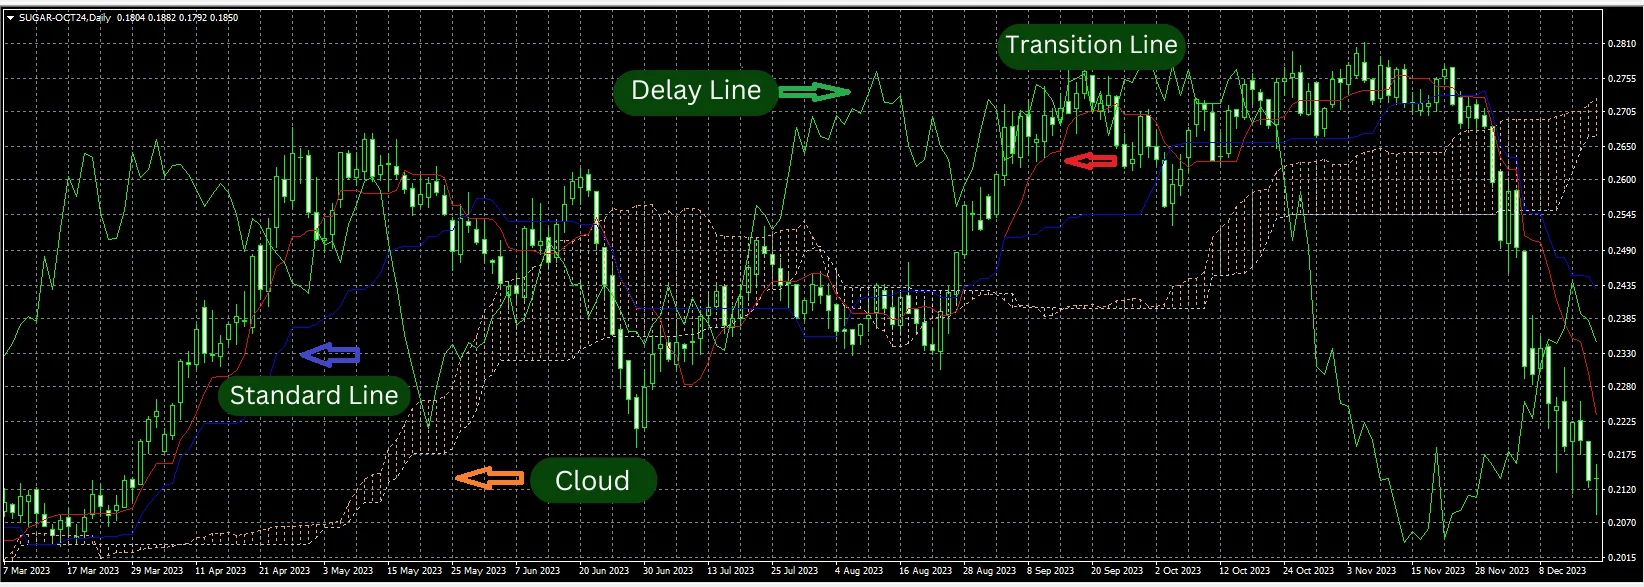
Tenkan-sen (Conversion Line):
The simple moving average of the highest and lowest prices over a certain period of time (usually 9 periods).
Meaning: Represents the short-term trend. When the Tenkan-sen crosses up above the Kijun-sen, it is often a buy signal; and vice versa, when it crosses down below the Kijun-sen, it is a sell signal.
Kijun-sen (Base Line):
- The simple moving average of the highest and lowest prices over a longer period of time (usually 26 periods).
- Meaning: Represents the mid-term trend. The Kijun-sen also acts as an important support or resistance level.
Senkou Span A:
- The simple moving average of the Tenkan-sen and Kijun-sen, then shifted forward by a number of periods (usually 26 periods).
- Meaning: Together with Senkou Span B it forms the Ichimoku cloud. Senkou Span A is often considered a potential support or resistance level.
Senkou Span B:
- The simple moving average of the highest and lowest prices over a longer period of time (usually 52 periods), then shifted forward by a number of periods (usually 26 periods).
- Meaning: Together with Senkou Span A it forms the Ichimoku cloud. Senkou Span B is often considered a potential support or resistance level.
Chikou Span (Lagging Span):
- The current closing price is drawn 26 periods into the past.
- Meaning: Compares the current price to past prices. When the Chikou Span crosses the price, it is a confirmation signal of the trend.
Ichimoku Cloud:
- Formed by Senkou Span A and Senkou Span B.
- Meaning: The cloud shows the dynamic support and resistance zones. When the price is above the cloud, the trend is considered increasing. Conversely, when the price is below the cloud, the trend is considered decreasing.
Trading method using Ichimoku Kinko Hyo
With its clear signals about trends, support and resistance levels, IKH becomes the basis for various trading strategies. Below are some popular trading methods based on this indicator.
Reading buy/sell signals based on cloud position and price
The Kumo cloud in Ichimoku Kinko Hyo acts as resistance or support lines.
When the price is above the Kumo cloud, it acts as a support line. Conversely, when the price is below the Kumo cloud, it becomes a resistance line.
.png.webp)
Price above cloud:
- Uptrend likely: Typically indicates an uptrend.
- Buy signal: When the price breaks above the cloud's top, it is a strong buy signal.
- Resistance level: The cloud's top may act as a resistance level.
Price below cloud:
- Downtrend likely: Typically indicates a downtrend.
- Sell signal: When the price breaks below the cloud's bottom, it is a strong sell signal.
- Support level: The cloud's bottom may act as a support level.
Price within cloud:
- Trend unclear: The market is in an accumulation or distribution phase.
- Trading opportunities: You can look for other trading signals from other IKH components like Tenkan-sen and Kijun-sen to identify entry points.
Thus, the Kumo cloud is an important factor in identifying resistance and support levels on the chart.
Inferring trends at the base line
The base line (Kijun-sen) is an important component in Ichimoku Kinko Hyo, acting as a dynamic support and resistance level. It helps traders determine the mid-term market trend.
.png.webp)
Uptrend:
- When the price closes above the base line and the lagging span crosses up above the base line, it confirms an uptrend.
- The base line has an upward tendency and may act as support.
Downtrend:
- When the price closes below the base line and the lagging span crosses down below the base line, it confirms a downtrend.
- The base line has a downward tendency and may act as resistance.
Sideways trend:
- When price fluctuates around the base line and the lagging span moves nearly parallel, it indicates a sideways market.
- The base line may act as both support and resistance.
Reading buy/sell signals at the crossing point between conversion line and price
The conversion line (Tenkan-sen) is an important component in Ichimoku Kinko Hyo, representing the short-term trend. When the Tenkan-sen crosses the price, it often provides notable trading signals.
.png.webp)
- Buy signal: When the conversion line crosses up above the price, it is often viewed as a buy signal. This implies the short-term trend may be shifting from downtrend to uptrend.
- Sell signal: Conversely, when the conversion line crosses down below the price, it is often viewed as a sell signal. This implies the short-term trend may be shifting from uptrend to downtrend.
Reading buy/sell signals when lagging span standard level crosses current price
Chikou Span is one of the key components of Ichimoku Kinko Hyo, representing the closing price drawn 26 periods into the past. When the Chikou Span crosses the current price, it provides notable trading signals.
- Buy signal: When the Chikou Span crosses up above the current price, it is often viewed as a confirmation of an uptrend. This implies the current price is following an uptrend and likely to continue rising in the future.
- Sell signal: Conversely, when the Chikou Span crosses down below the current price, it is often viewed as a confirmation of a downtrend. This implies the current price is following a downtrend and likely to continue falling in the future.
Buy/sell assessment from the movement of 4 elements
To evaluate buy/sell signals from Ichimoku Kinko Hyo, you need to consider the interactions of all four elements. When these elements form a consistent signal, the reliability of the signal will be higher.
Signals are generated at the cloud breakthrough point, trend determination on the base line and at the crossing of the conversion line with the lagging span standard level.
.png.webp)
In the example chart, a sell signal from the "cloud, base line, conversion line, lagging span" appeared at point 3. Therefore, you can decide to place a sell order at point 3.
See also:
- Boost Your Trading Strategy with MACD MT4 Indicator Setup Guide
- RSI MT4 Guide: Maximize Profits with Precision Trade Signals
Similarly, all buy signals were identified at point 5, so you can evaluate and place a buy order.
Additionally, at point 6, when the price rose and broke above the cloud, this created buy signals from both the base line and conversion line, indicating you can continue placing a buy order.
So in summary, you could place a buy order at (3), place a short order at (5), and place another short order at (6).
Understanding and effectively using the components of the Ichimoku Cloud can help make more accurate trading decisions. To apply this knowledge in practice, Ichimoku Kinko Hyo MT4 is an essential tool in your trading toolkit.


.png.webp)
.png.webp)